Plotting Model Coefficients
coefplot.RdProvides an S3 generic method for plotting coefficients from a model so it can be extended to other model types.
A graphical display of the coefficients and standard errors from a fitted model
coefplot(model, ...)
Arguments
| model | The fitted model with coefficients to be plotted |
|---|---|
| ... | See |
Value
A ggplot2 object or data.frame. See details in coefplot.lm for more information
Details
Currently, methods are available for lm, glm and rxLinMod objects.
coefplot is the S3 generic method for plotting the coefficients from a fitted model.
This can be extended with new methods for other types of models not currently available.
A future iteration of coefplot.glm will also allow for plotting the coefficients on the transformed scale.
See coefplot.lm for specific documentation and the return value.
See also
Examples
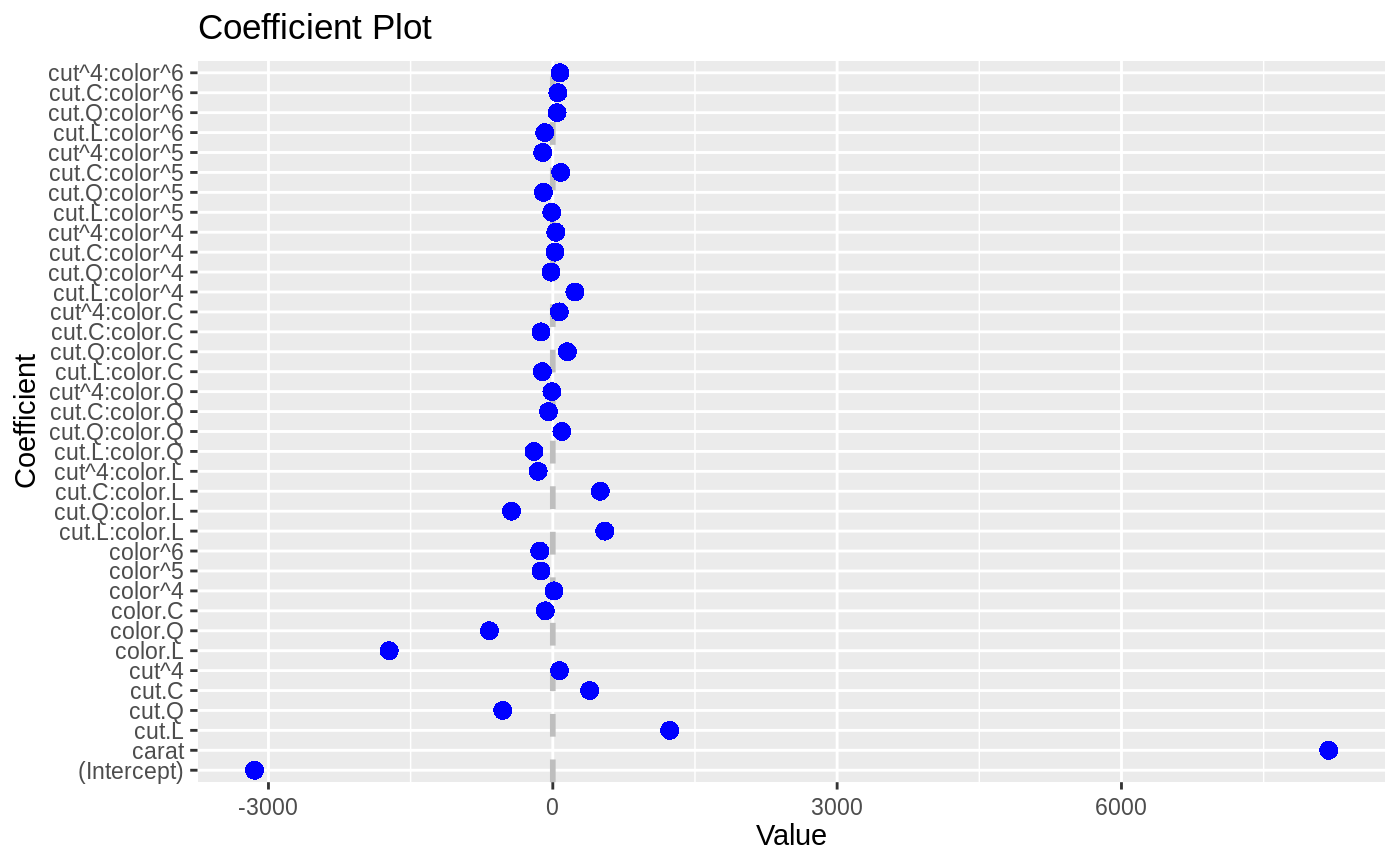
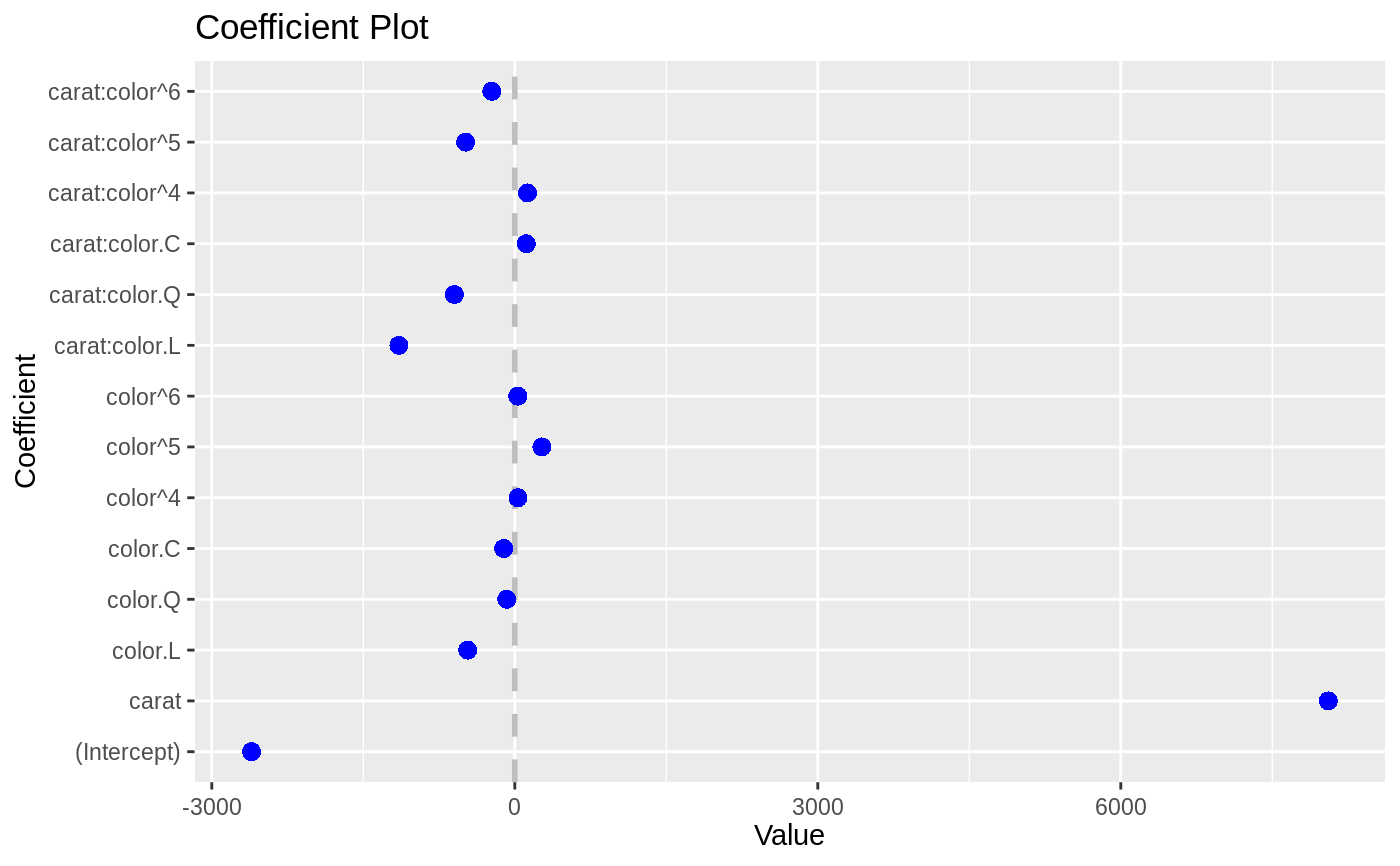
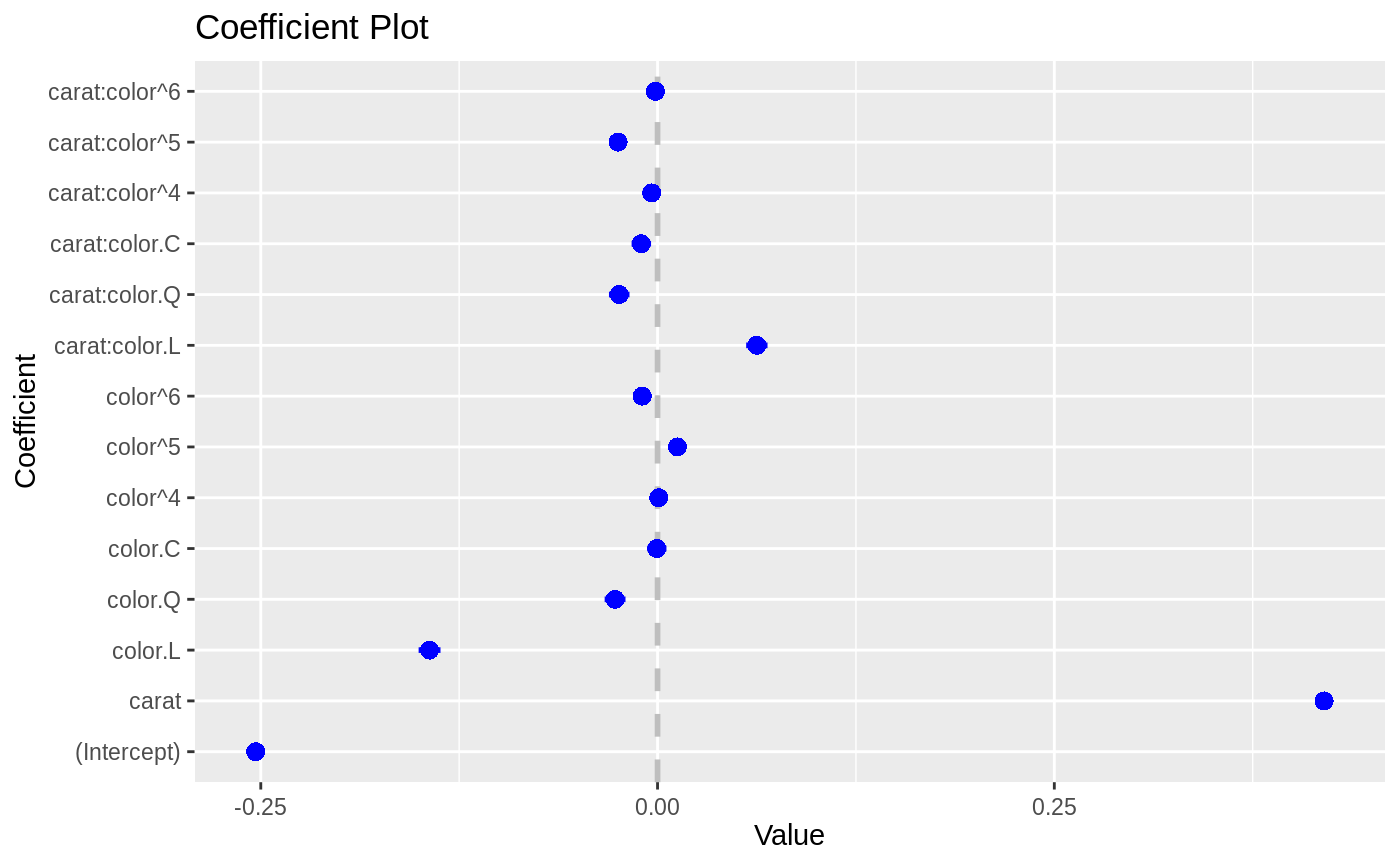
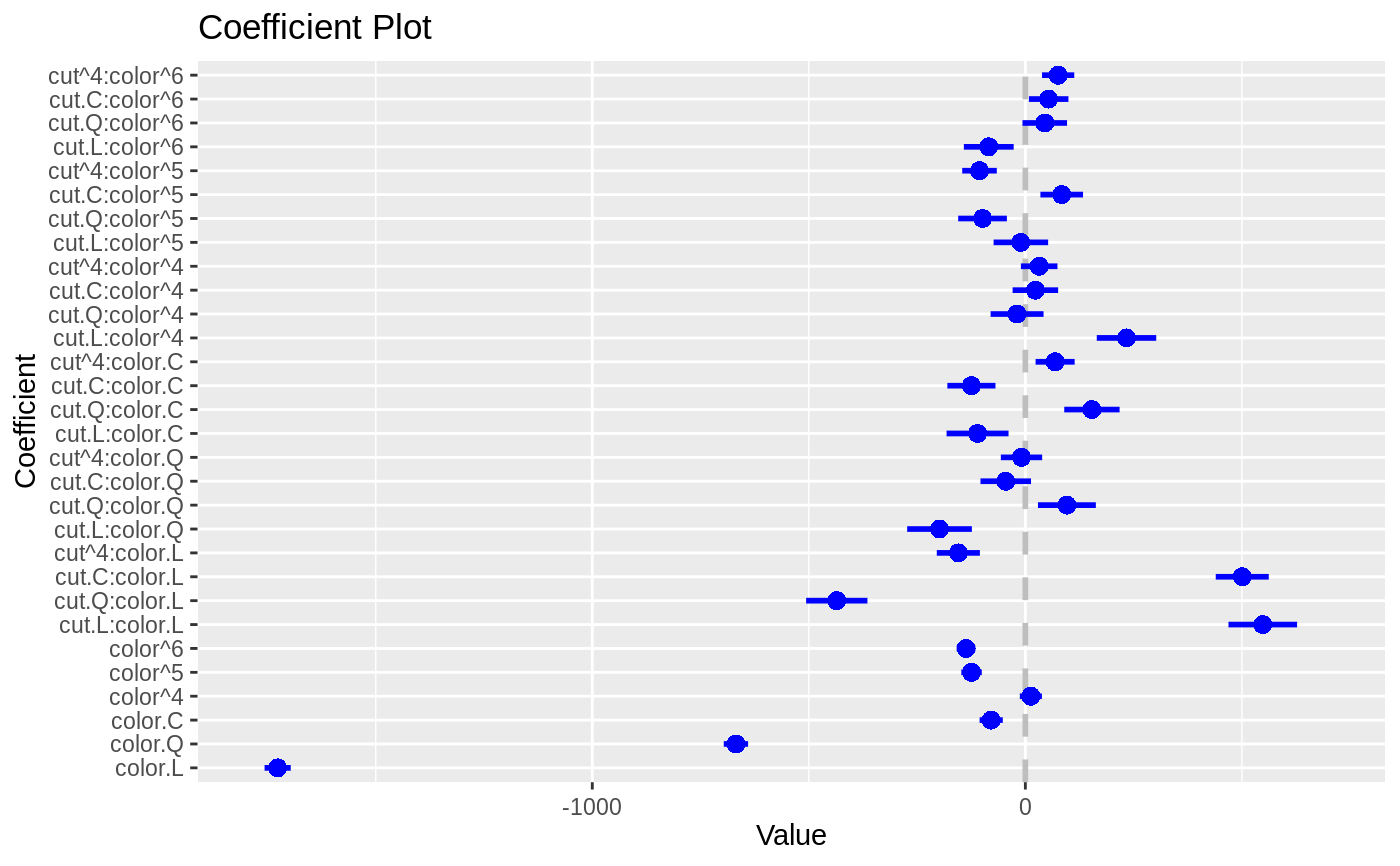
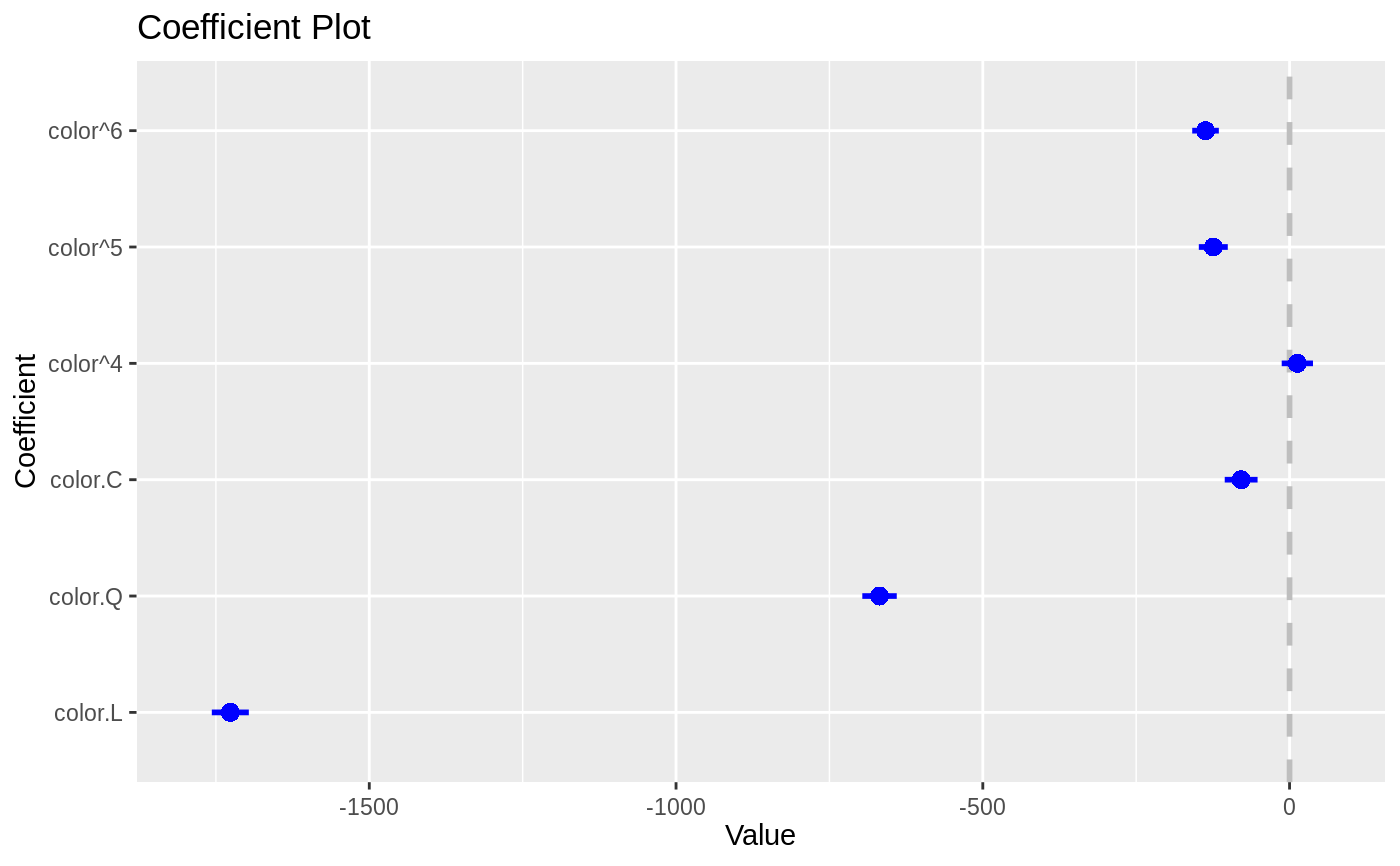
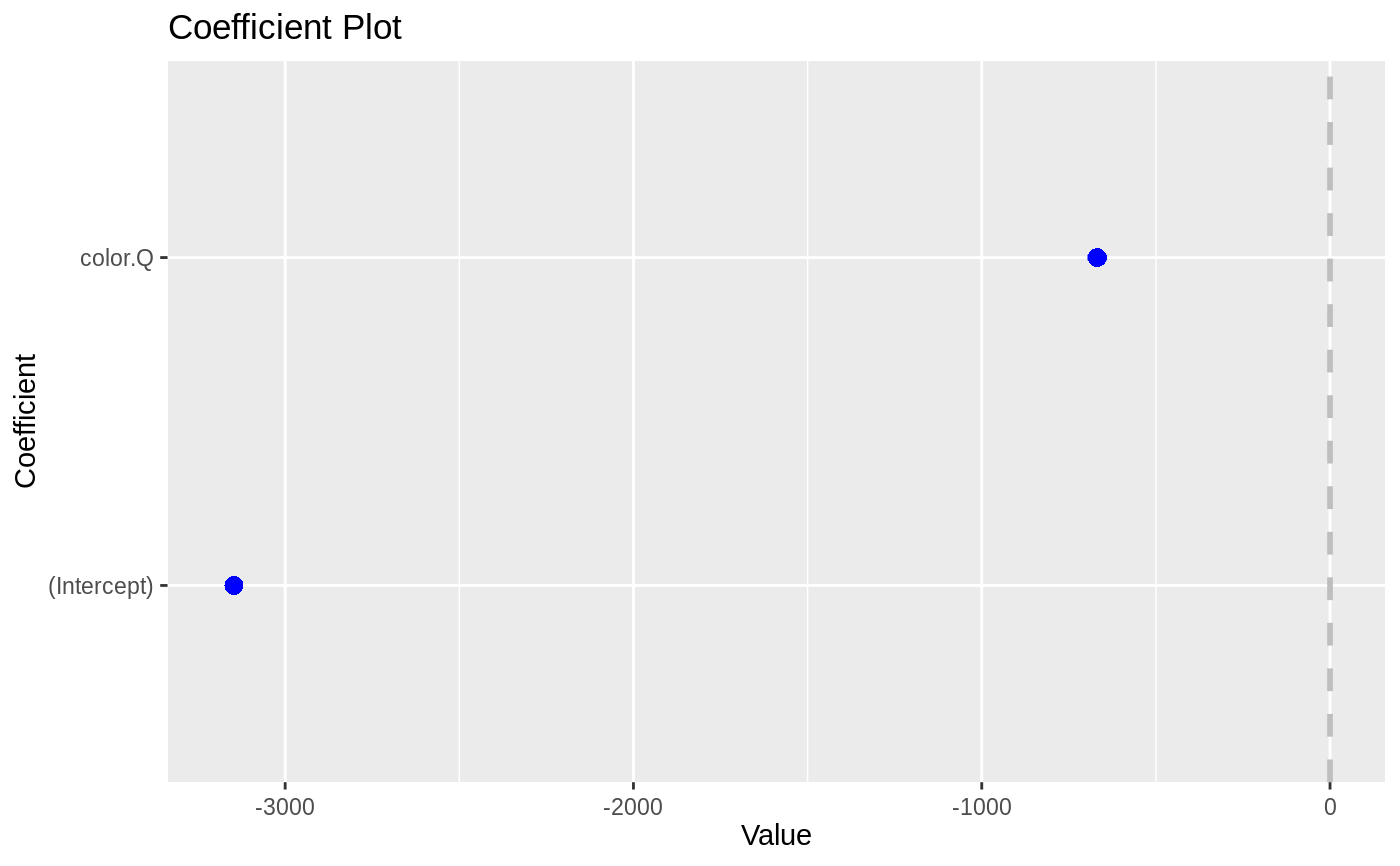
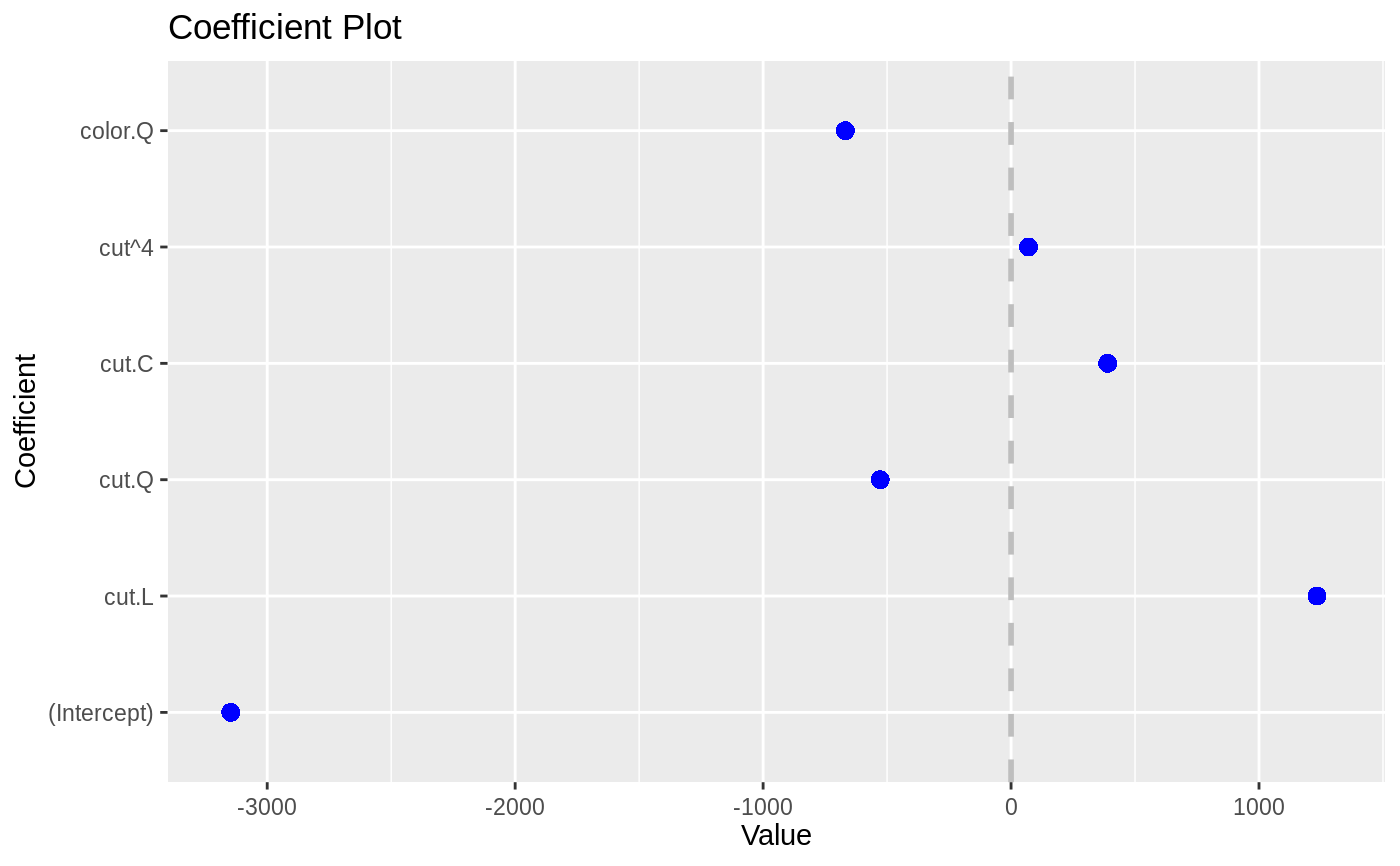
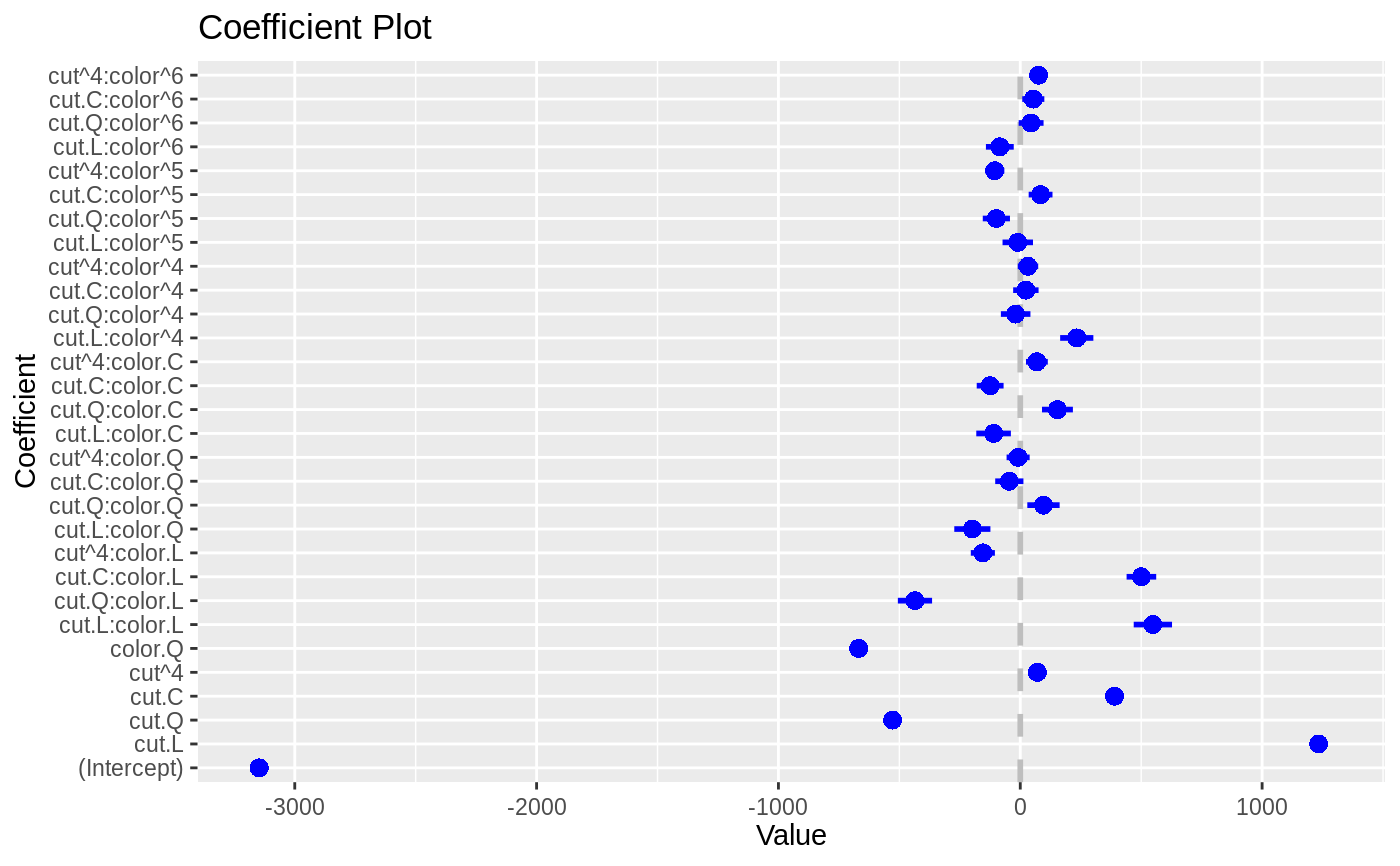
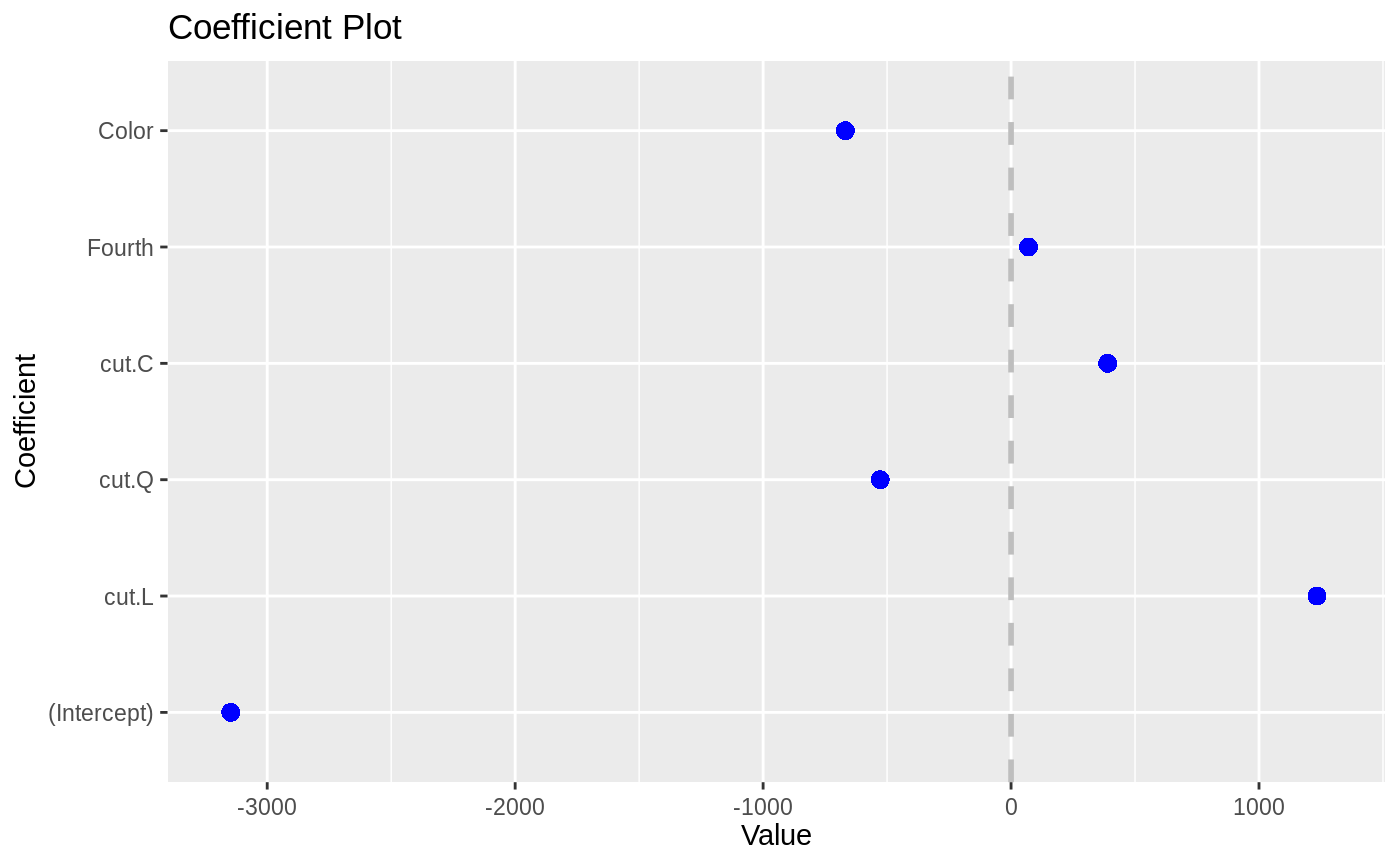
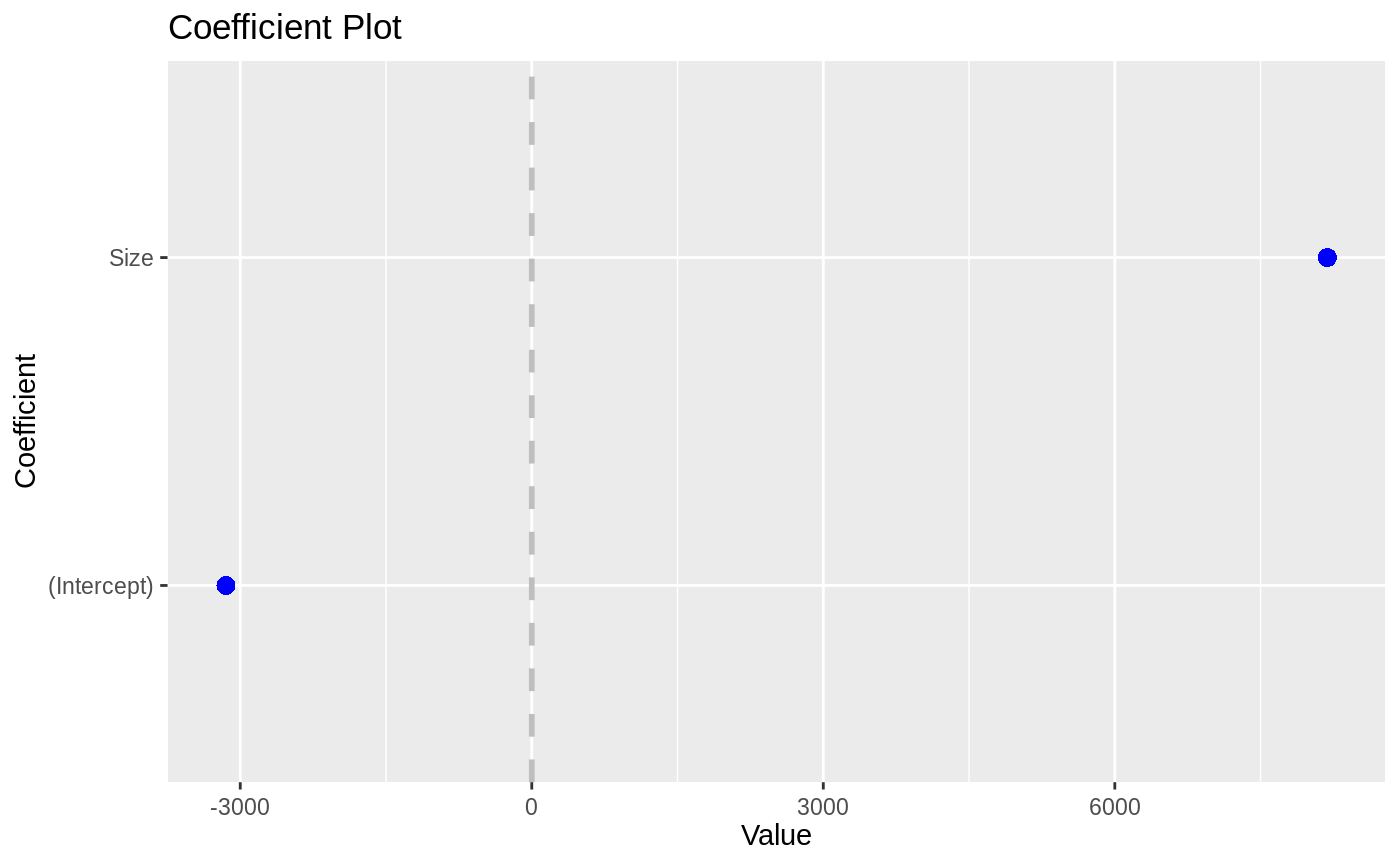
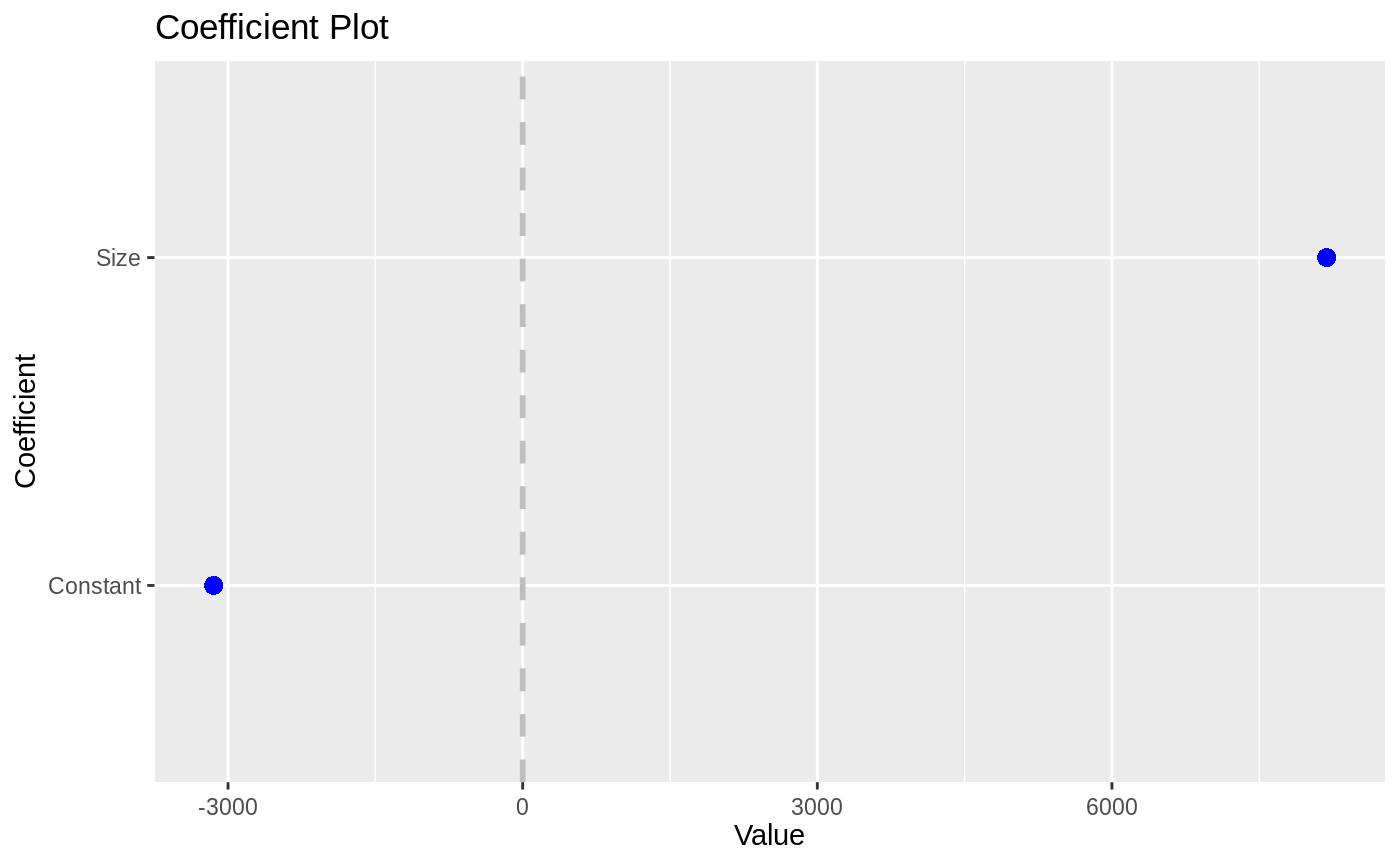
#> # A tibble: 6 x 10 #> carat cut color clarity depth table price x y z #> <dbl> <ord> <ord> <ord> <dbl> <dbl> <int> <dbl> <dbl> <dbl> #> 1 0.23 Ideal E SI2 61.5 55 326 3.95 3.98 2.43 #> 2 0.21 Premium E SI1 59.8 61 326 3.89 3.84 2.31 #> 3 0.23 Good E VS1 56.9 65 327 4.05 4.07 2.31 #> 4 0.290 Premium I VS2 62.4 58 334 4.2 4.23 2.63 #> 5 0.31 Good J SI2 63.3 58 335 4.34 4.35 2.75 #> 6 0.24 Very Good J VVS2 62.8 57 336 3.94 3.96 2.48model1 <- lm(price ~ carat + cut*color, data=diamonds) model2 <- lm(price ~ carat*color, data=diamonds) model3 <- glm(price > 10000 ~ carat*color, data=diamonds) coefplot(model1)coefplot(model2)coefplot(model3)coefplot(model1, predictors="color")coefplot(model1, predictors="color", strict=TRUE)coefplot(model1, predictors="cut", coefficients=c("(Intercept)", "color.Q"), strict=TRUE, newNames=c(color.Q="Color", "cut^4"="Fourth"))coefplot(model1, predictors=c("(Intercept)", "carat"), newNames=c(carat="Size", "(Intercept)"="Constant"))
