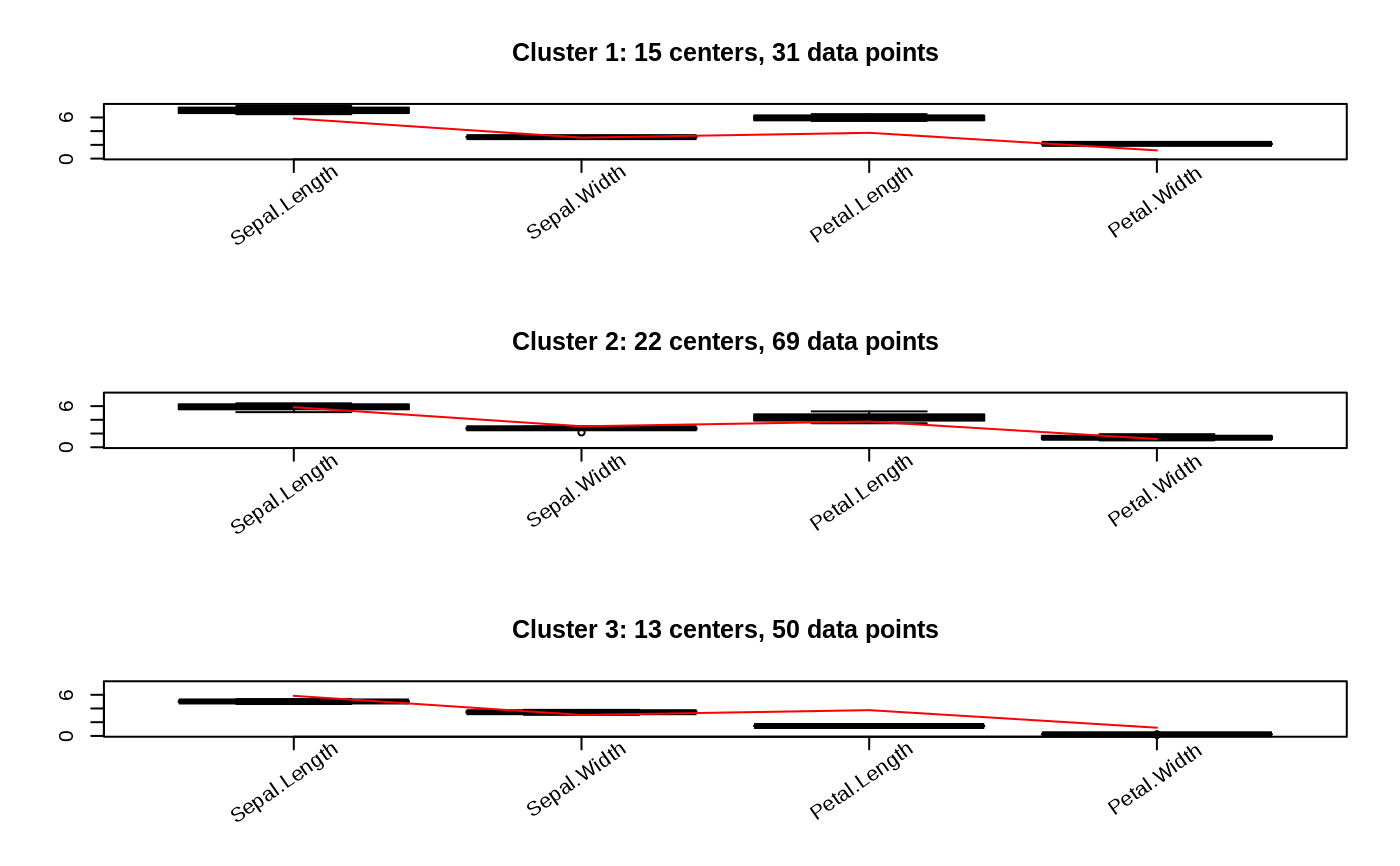
Boxplot of Cluster Profiles
boxplot.bclust.RdMakes boxplots of the results of a bagged clustering run.
# S3 method for bclust
boxplot(x, n=nrow(x$centers), bycluster=TRUE,
        main=deparse(substitute(x)), oneplot=TRUE,
        which=1:n, ...)
Arguments
| x | Clustering result, object of class |
|---|---|
| n | Number of clusters to plot, by default the number of clusters
used in the call of |
| bycluster | If |
| main | Main title of the plot, by default the name of the cluster object. |
| oneplot | If |
| which | Number of clusters which should be plotted, default is all clusters. |
| ... | Additional arguments for |
Examples
#> Committee Member: 1(1) 2(1) 3(1) 4(1) 5(1) 6(1) 7(1) 8(1) 9(1) 10(1) #> Computing Hierarchical Clusteringboxplot(bc1)