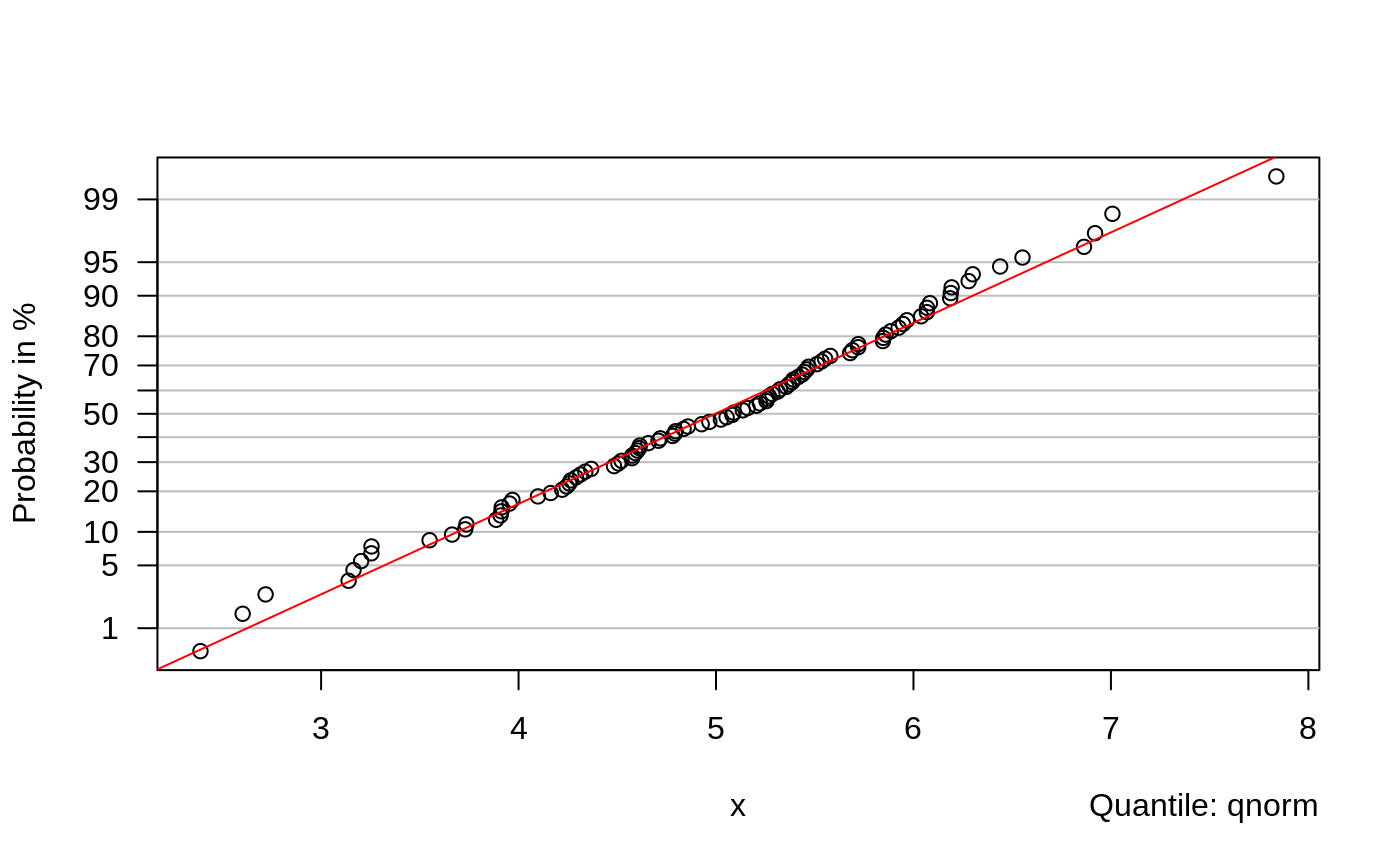
Probability Plot
probplot.RdGenerates a probability plot for a specified theoretical
distribution, i.e., basically a
qqplot where the y-axis is labeled with
probabilities instead
of quantiles. The function
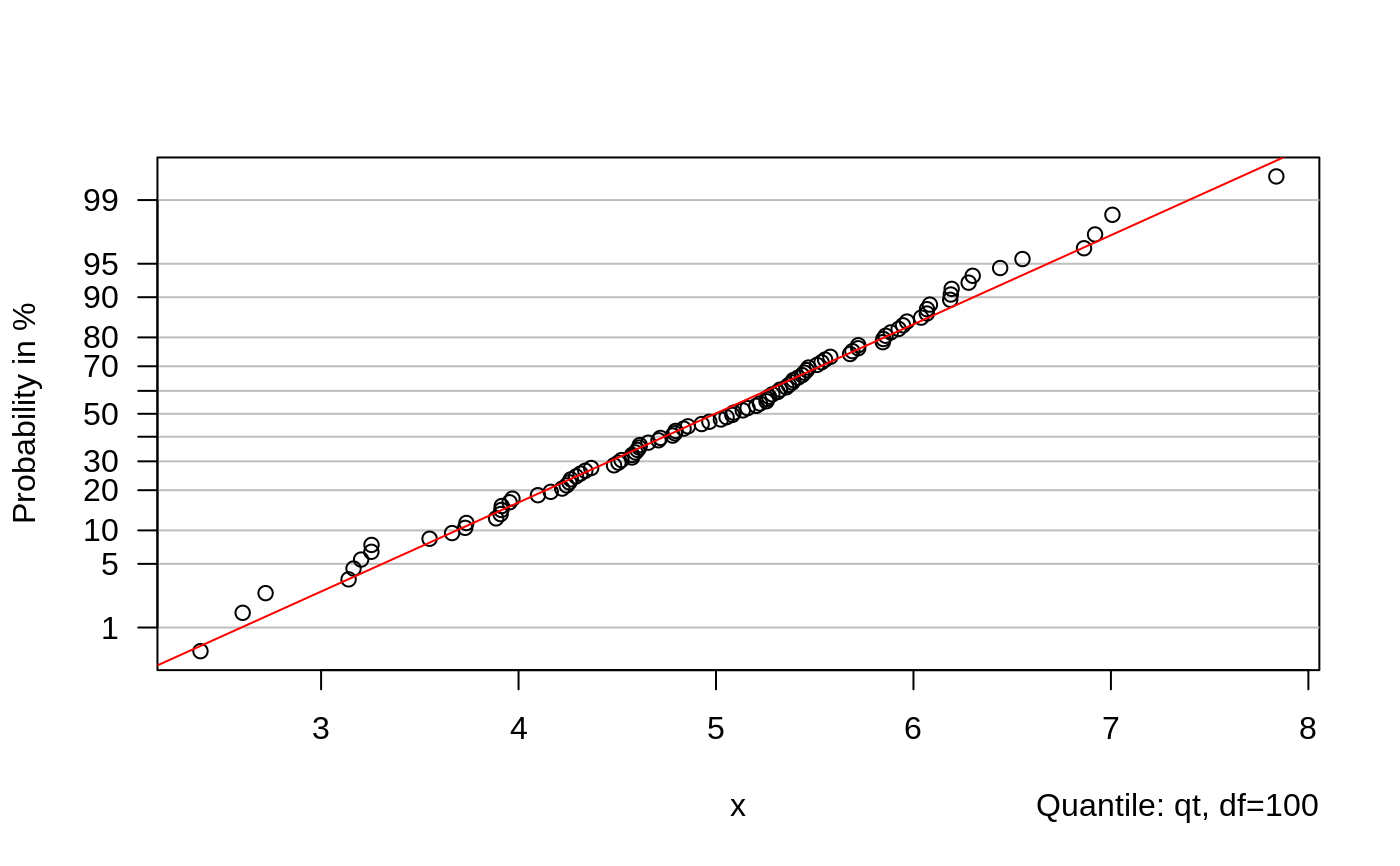
is mainly intended for teaching the concept of quantile plots.
probplot(x, qdist=qnorm, probs=NULL, line=TRUE,
         xlab=NULL, ylab="Probability in %", ...)
# S3 method for probplot
lines(x, h=NULL, v=NULL, bend=FALSE, ...)
Arguments
| x | A data vector for |
|---|---|
| qdist | A character string or a function for the quantiles of the target distribution. |
| probs | Vector of probabilities at which horizontal lines should be drawn. |
| line | Add a line passing through the quartiles to the plot? |
| xlab, ylab | Graphical parameters. |
| h | The y-value for a horizontal line. |
| v | The x-value for a vertical line. |
| bend | If |
| ... | Further arguments for |
See also
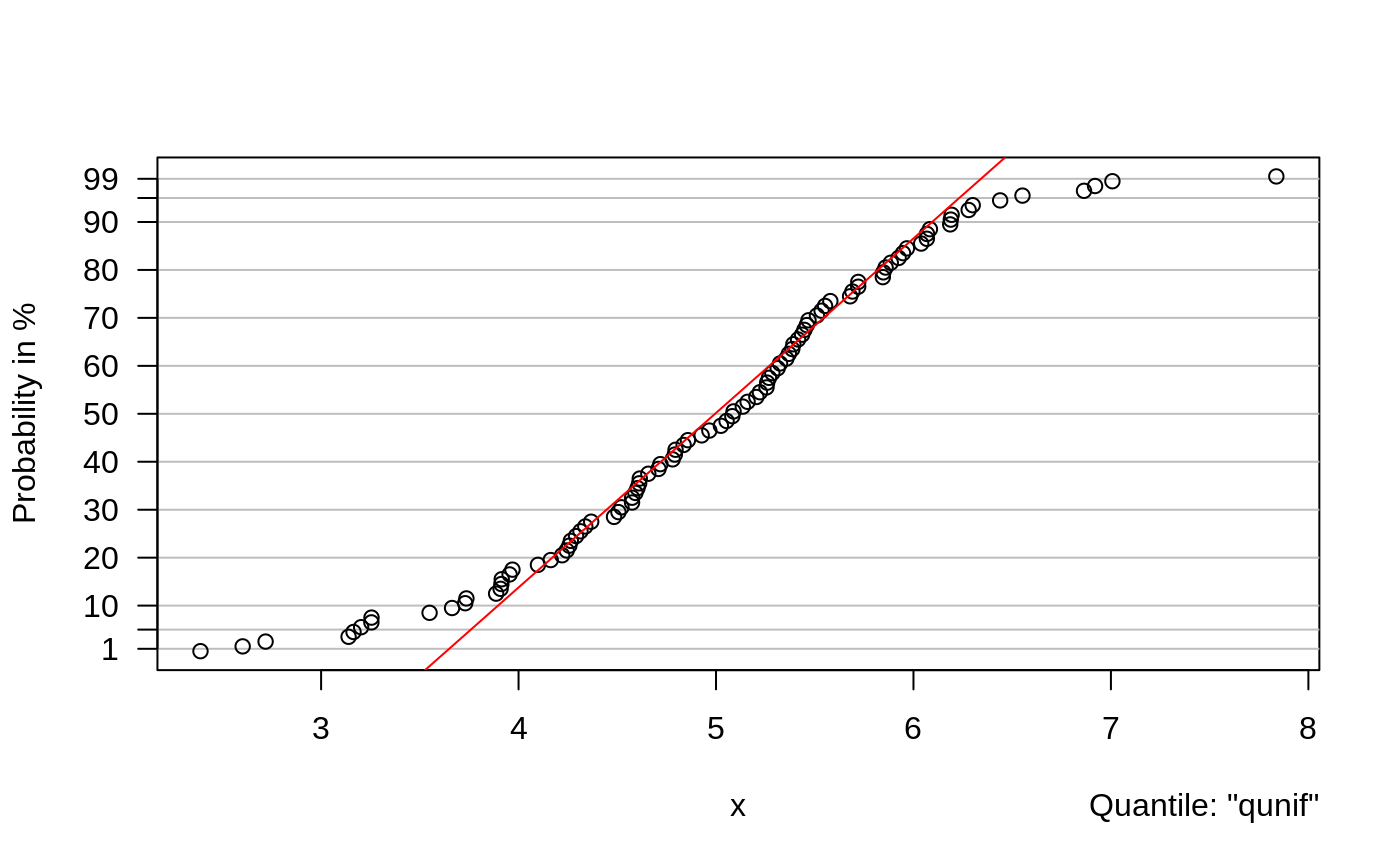
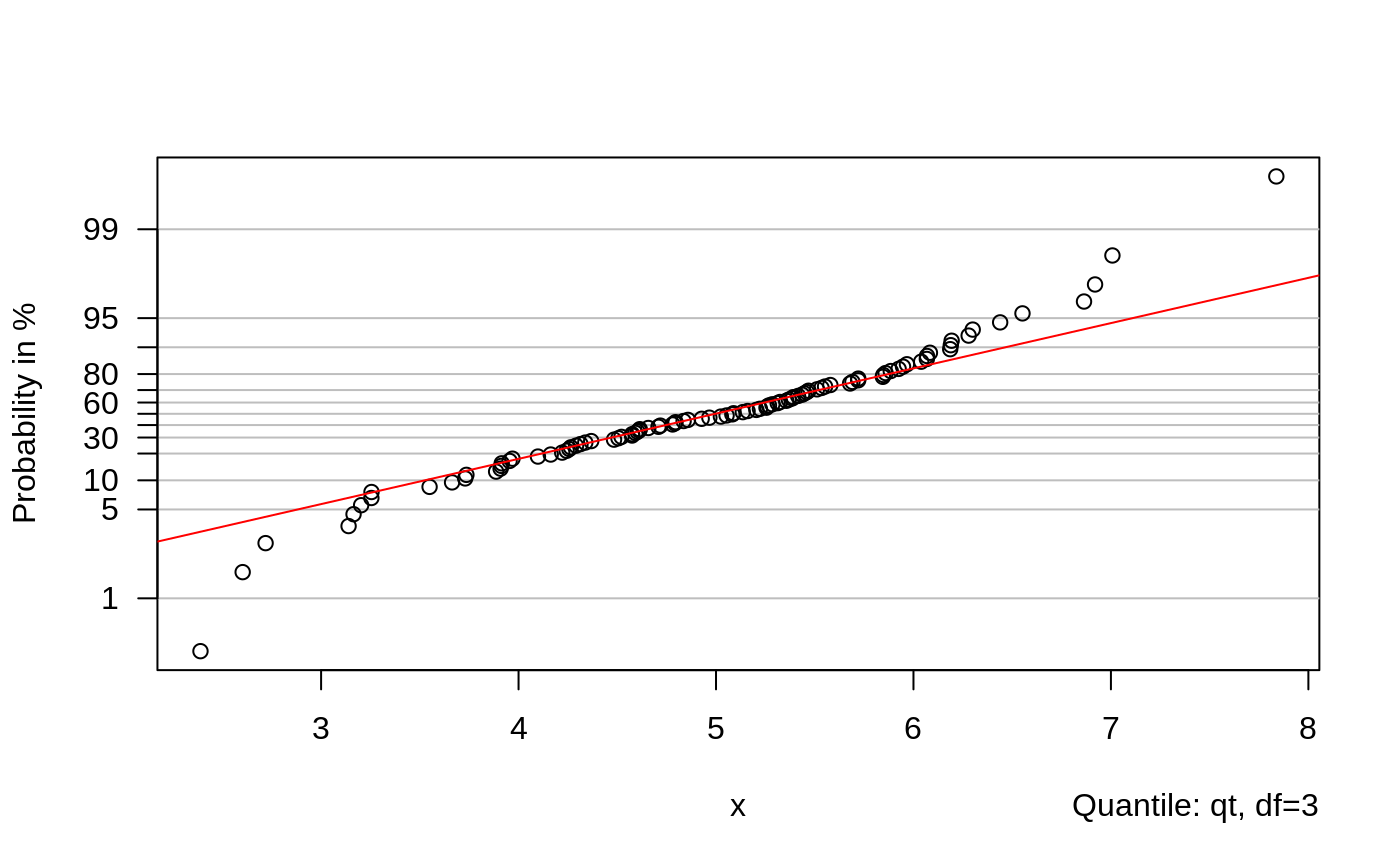
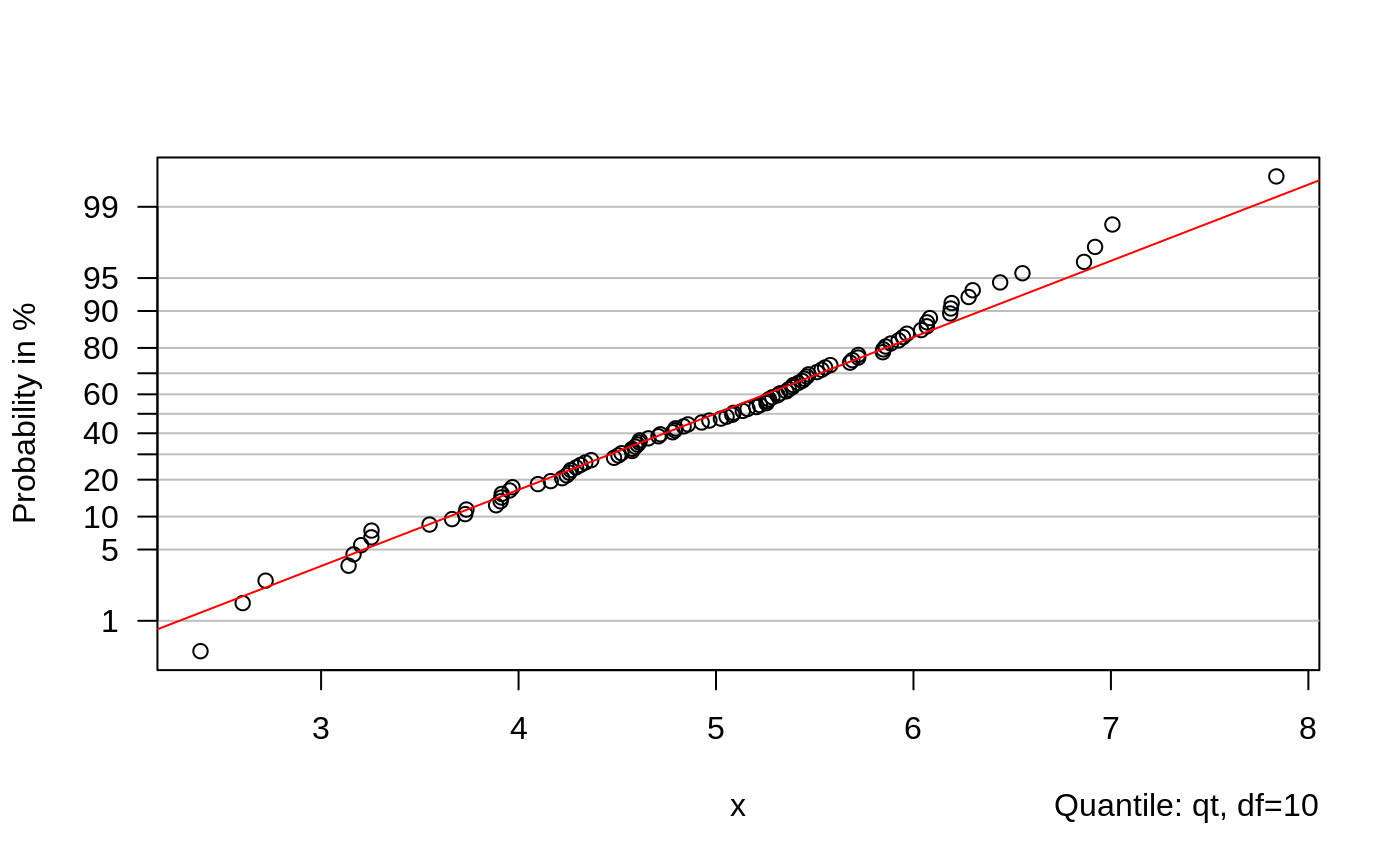
Examples
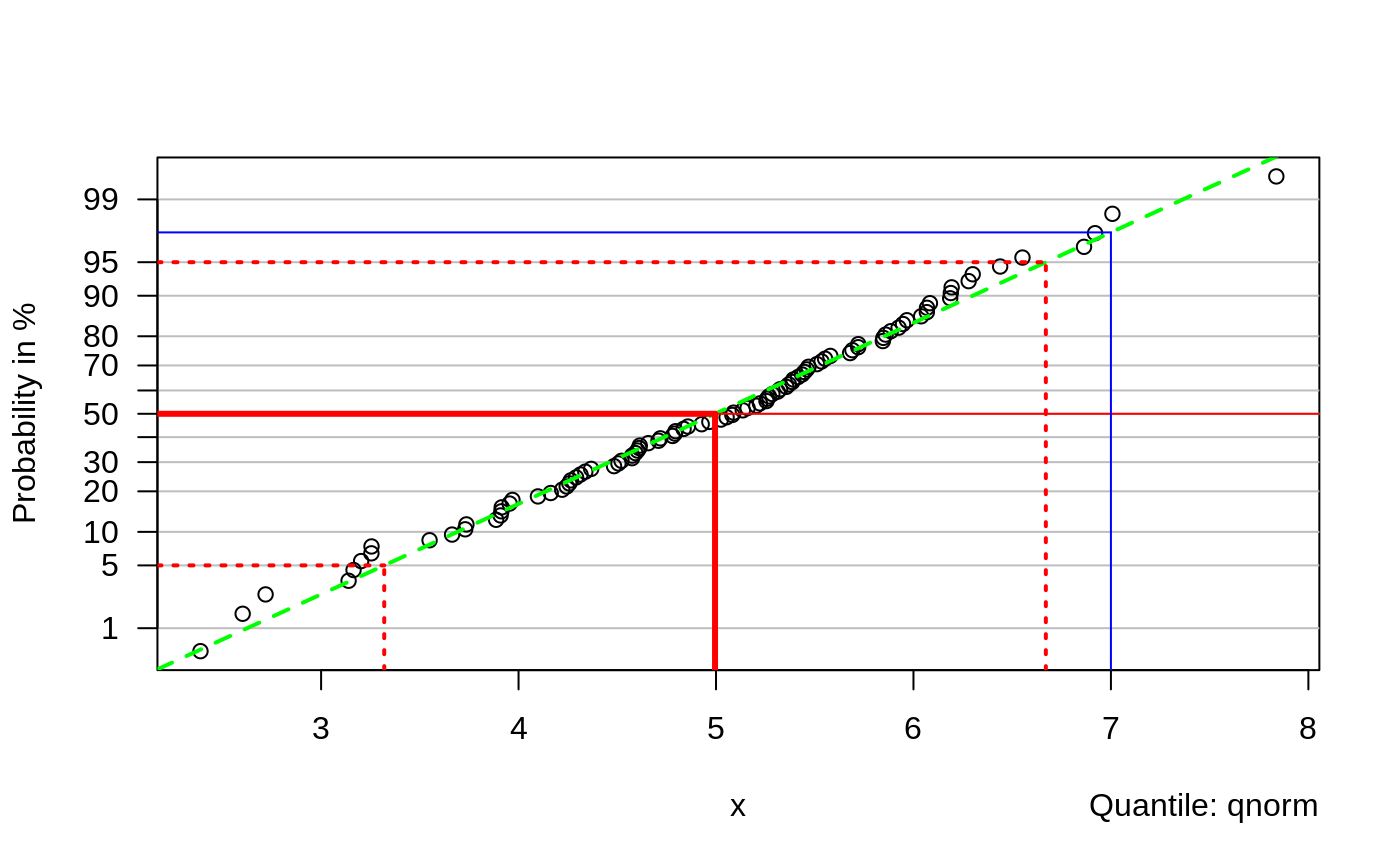
## this should show the lack of fit at the tails probplot(x, "qunif")## for increasing degrees of freedom the t-distribution converges to ## normal probplot(x, qt, df=1)probplot(x, qt, df=3)probplot(x, qt, df=10)probplot(x, qt, df=100)## manually add the line through the quartiles p <- probplot(x, line=FALSE)### The following use the estimted distribution given by the green ### line: ## What is the probability that x is smaller than 7? lines(p, v=7, bend=TRUE, col="blue")par(opar)#> NULL