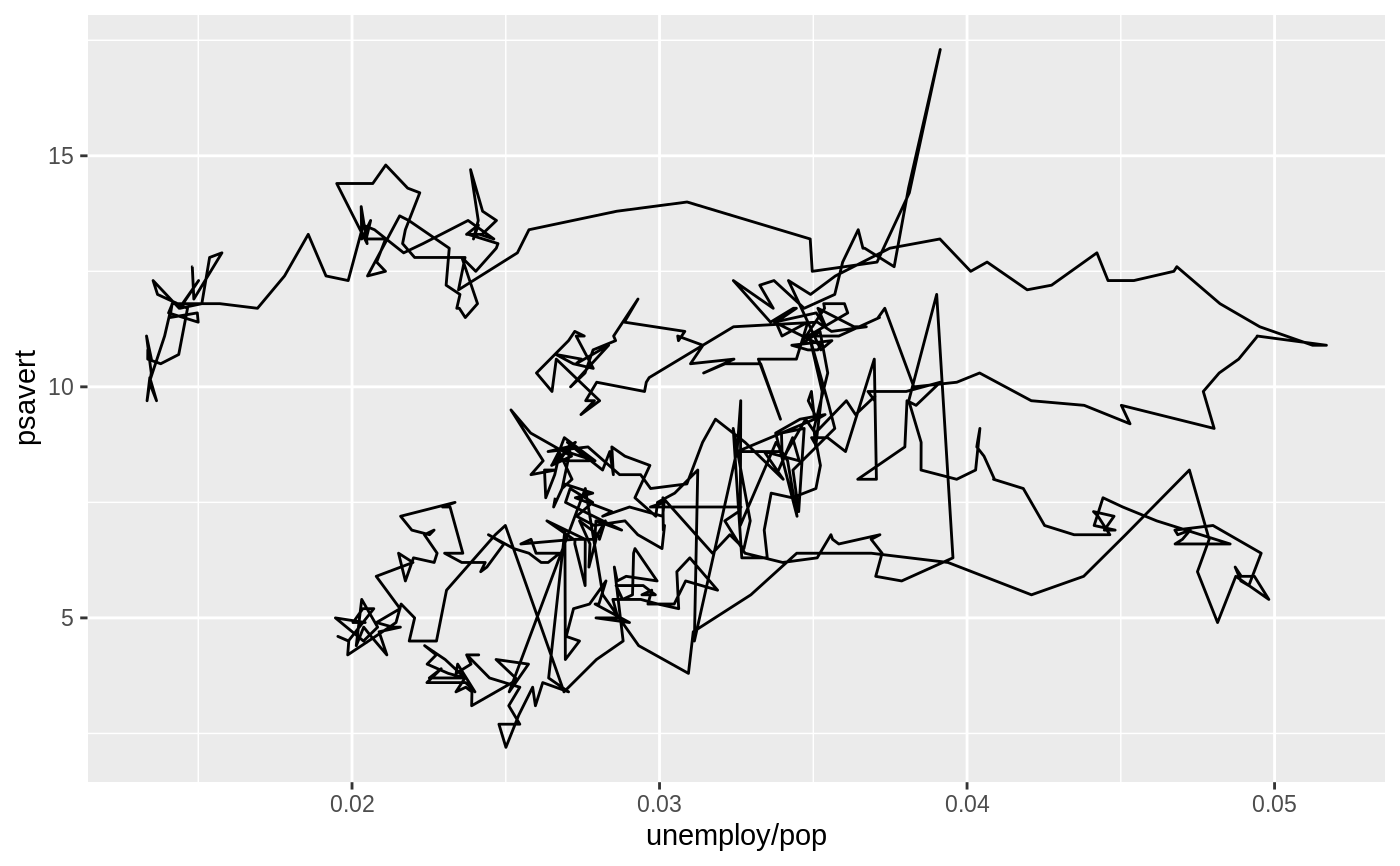
geom_path() connects the observations in the order in which they appear
in the data. geom_line() connects them in order of the variable on the
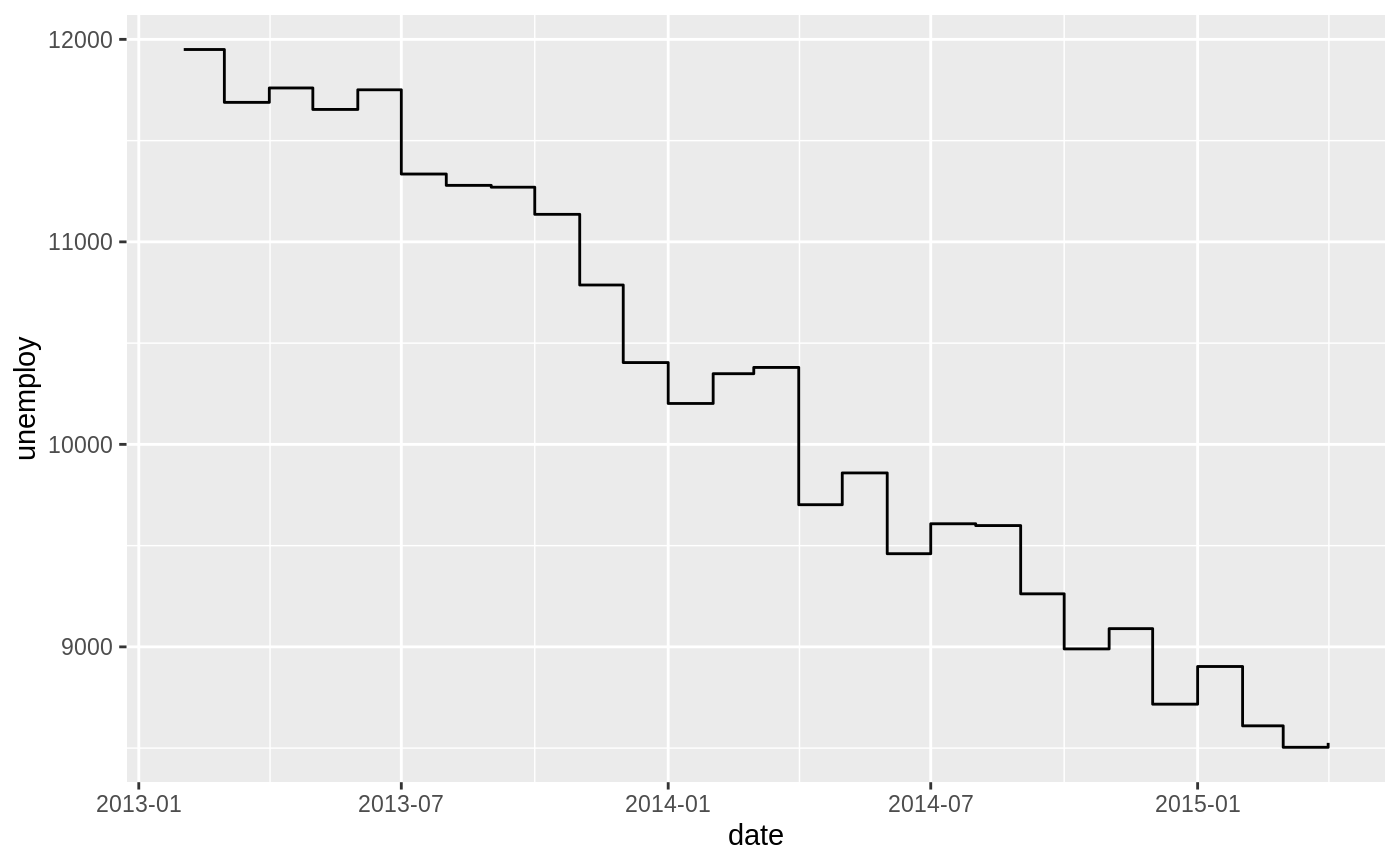
x axis. geom_step() creates a stairstep plot, highlighting exactly
when changes occur. The group aesthetic determines which cases are
connected together.
geom_path(mapping = NULL, data = NULL, stat = "identity",
  position = "identity", ..., lineend = "butt", linejoin = "round",
  linemitre = 10, arrow = NULL, na.rm = FALSE, show.legend = NA,
  inherit.aes = TRUE)

geom_line(mapping = NULL, data = NULL, stat = "identity",
  position = "identity", na.rm = FALSE, show.legend = NA,
  inherit.aes = TRUE, ...)

geom_step(mapping = NULL, data = NULL, stat = "identity",
  position = "identity", direction = "hv", na.rm = FALSE,
  show.legend = NA, inherit.aes = TRUE, ...)
Arguments
| mapping | Set of aesthetic mappings created by |
|---|---|
| data | The data to be displayed in this layer. There are three options: If A A |
| stat | The statistical transformation to use on the data for this layer, as a string. |
| position | Position adjustment, either as a string, or the result of a call to a position adjustment function. |
| ... | Other arguments passed on to |
| lineend | Line end style (round, butt, square). |
| linejoin | Line join style (round, mitre, bevel). |
| linemitre | Line mitre limit (number greater than 1). |
| arrow | Arrow specification, as created by |
| na.rm | If |
| show.legend | logical. Should this layer be included in the legends?
|
| inherit.aes | If |
| direction | direction of stairs: 'vh' for vertical then horizontal, or 'hv' for horizontal then vertical. |
Details
An alternative parameterisation is geom_segment(), where each line
corresponds to a single case which provides the start and end coordinates.
Aesthetics
geom_path() understands the following aesthetics (required aesthetics are in bold):
xyalphacolourgrouplinetypesize
Learn more about setting these aesthetics in vignette("ggplot2-specs").
Missing value handling
geom_path(), geom_line(), and geom_step handle NA as follows:
If an
NAoccurs in the middle of a line, it breaks the line. No warning is shown, regardless of whetherna.rmisTRUEorFALSE.If an
NAoccurs at the start or the end of the line andna.rmisFALSE(default), theNAis removed with a warning.If an
NAoccurs at the start or the end of the line andna.rmisTRUE, theNAis removed silently, without warning.
See also
geom_polygon(): Filled paths (polygons);
geom_segment(): Line segments
Examples
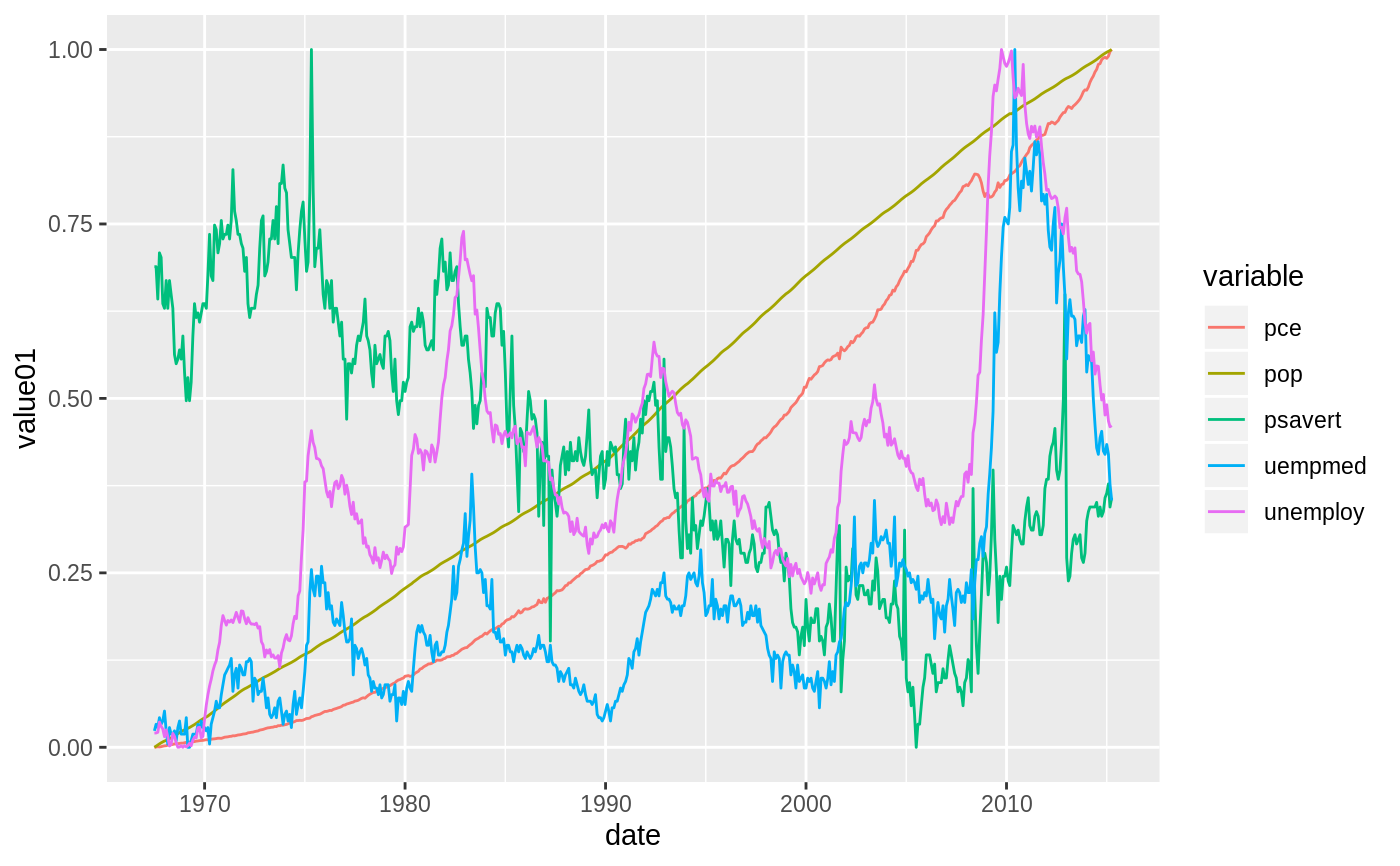
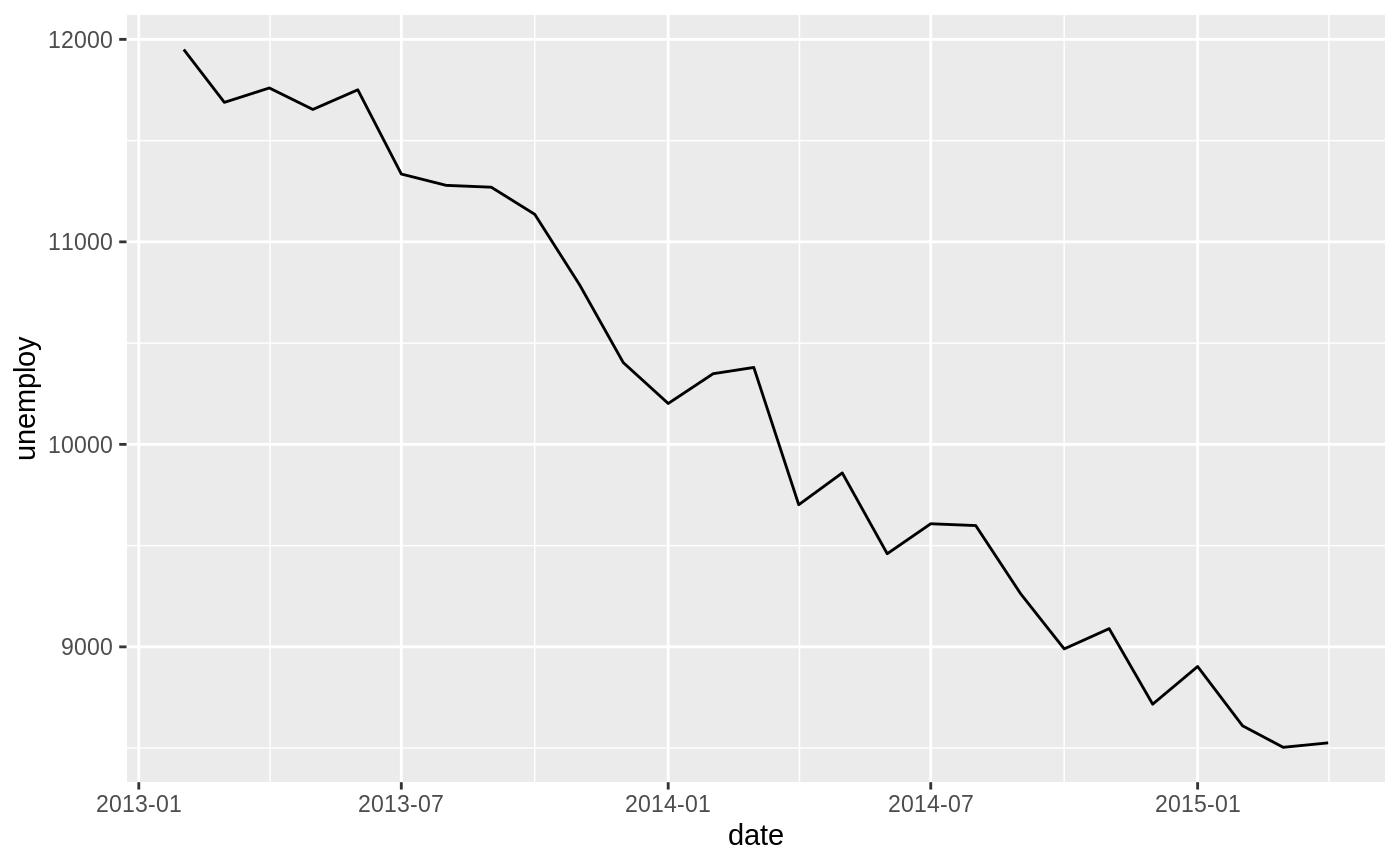
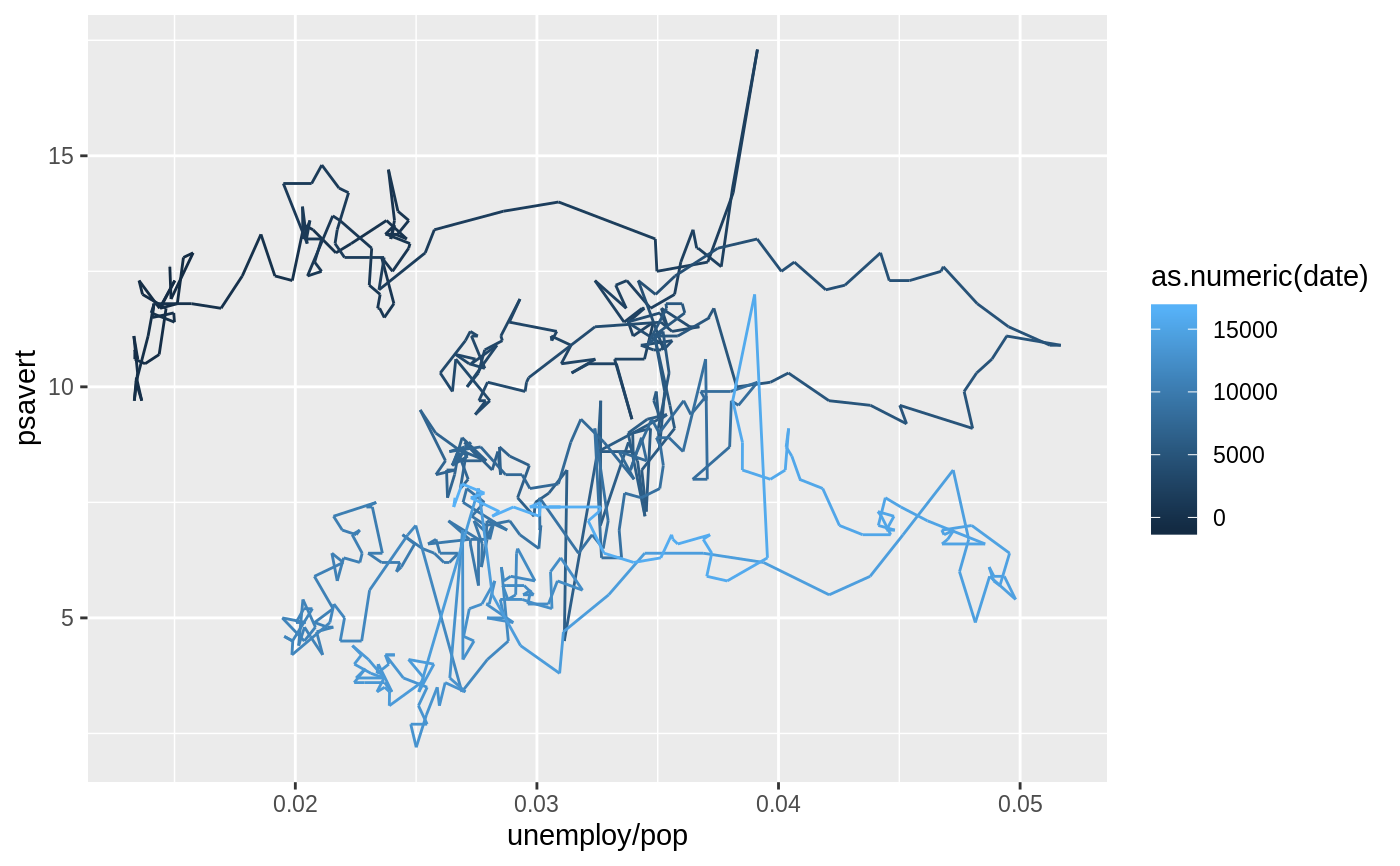
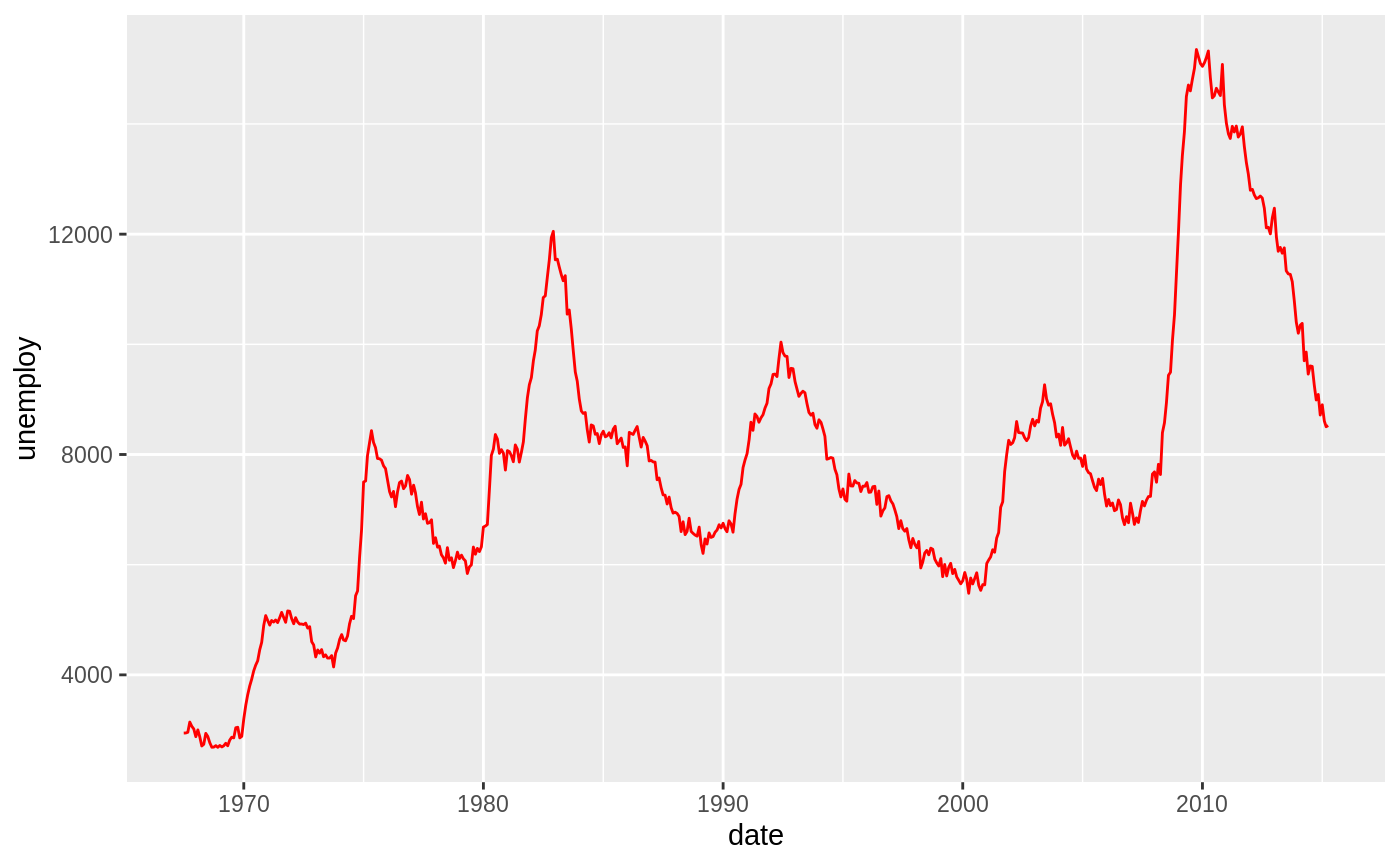
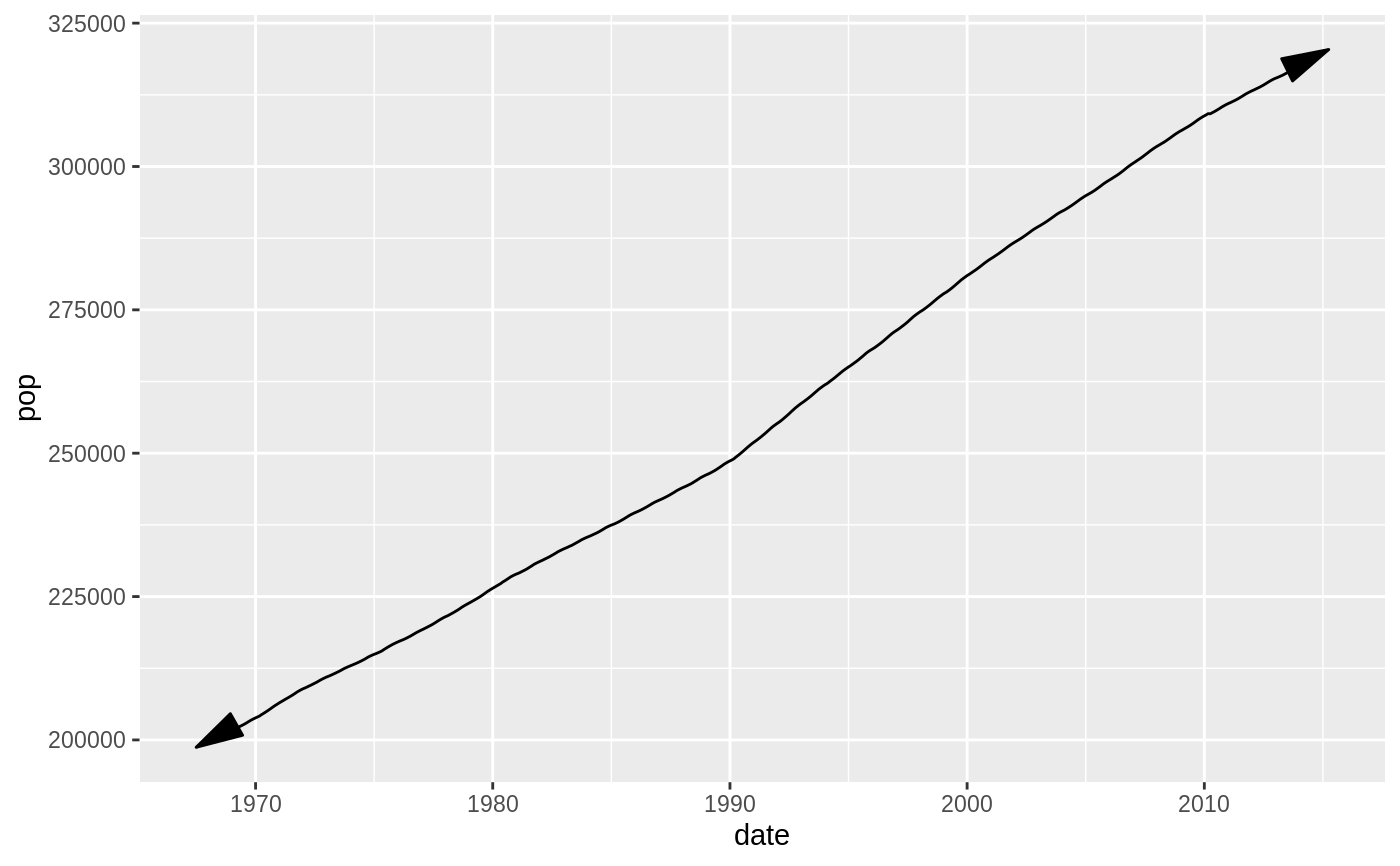
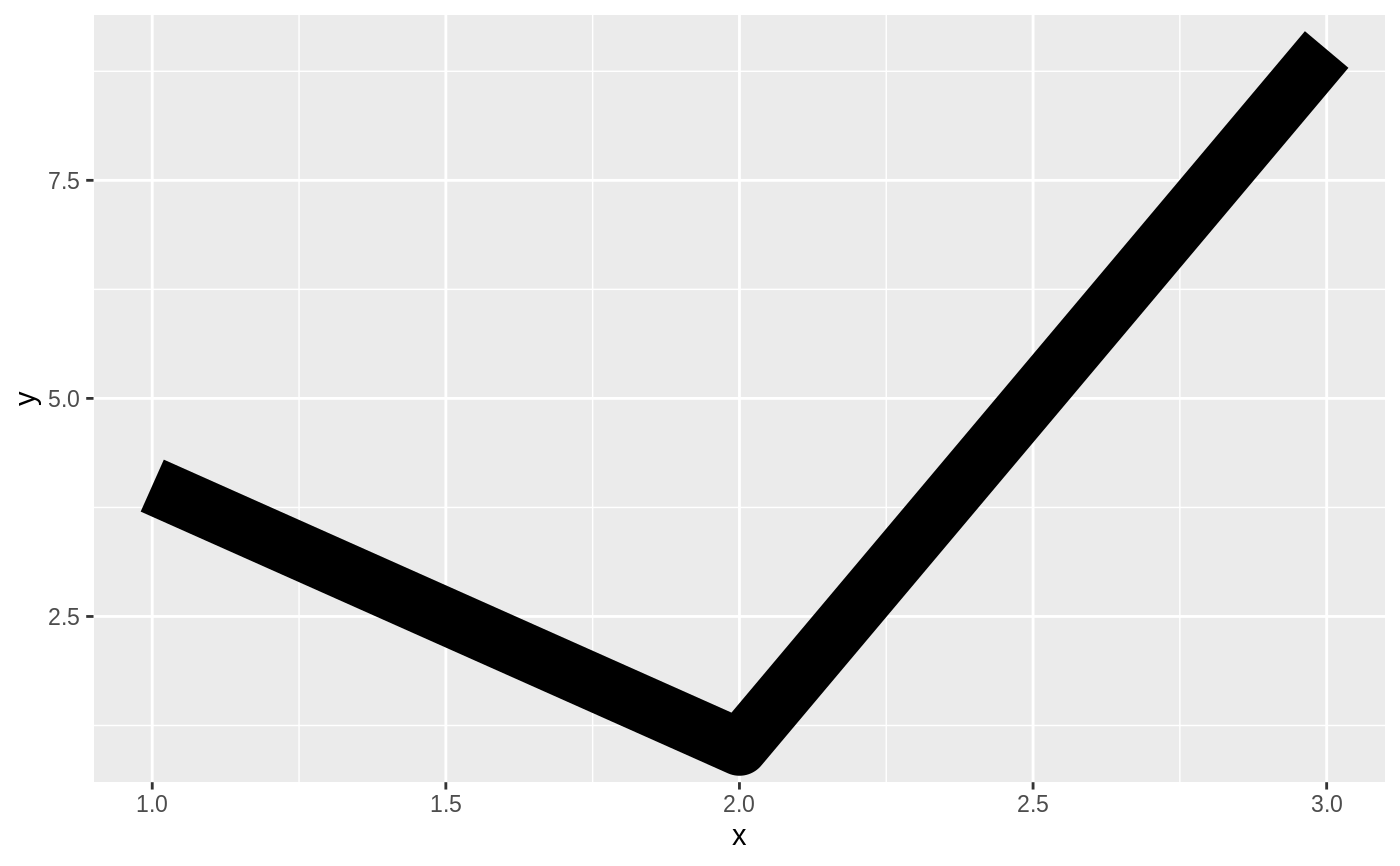
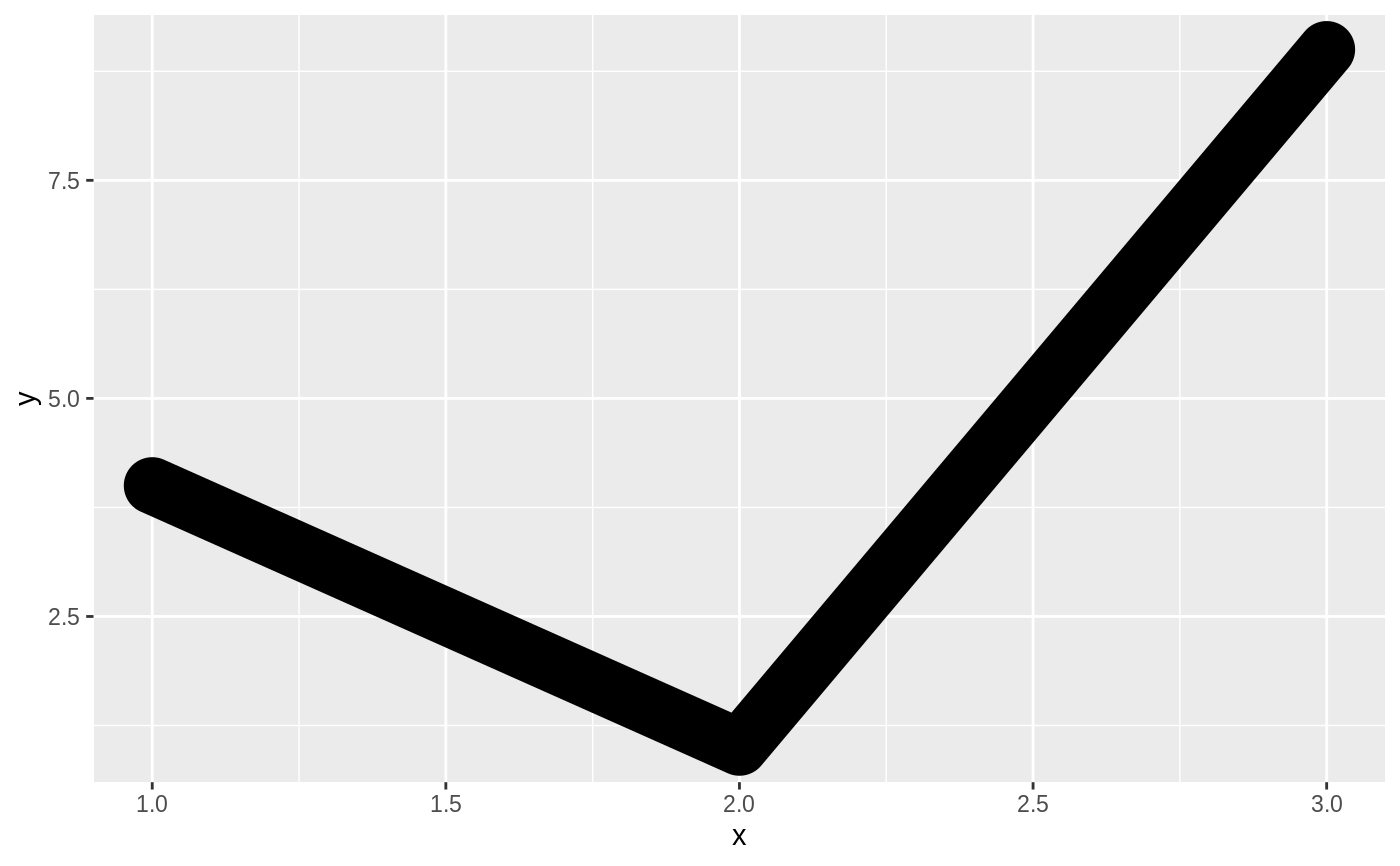
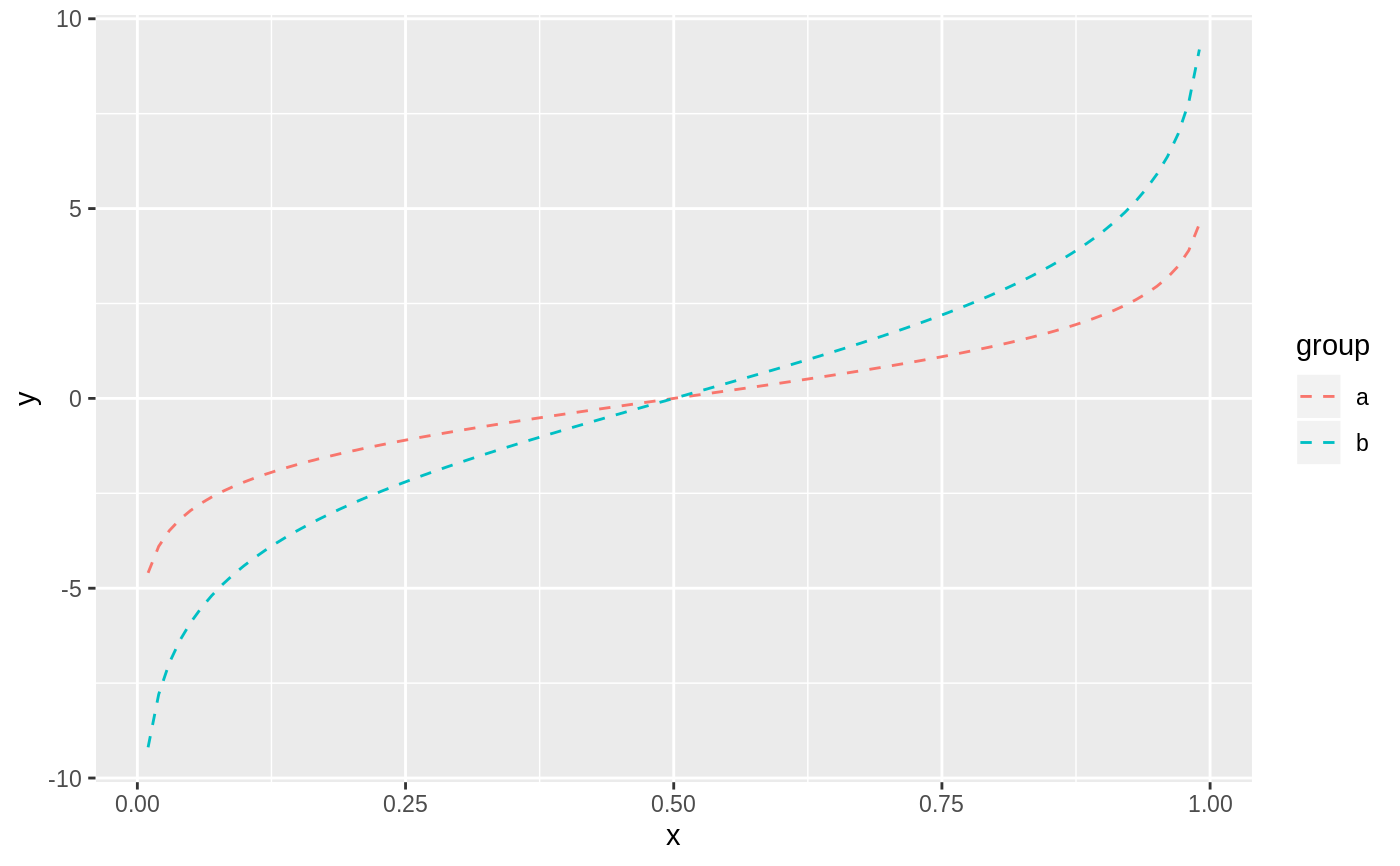
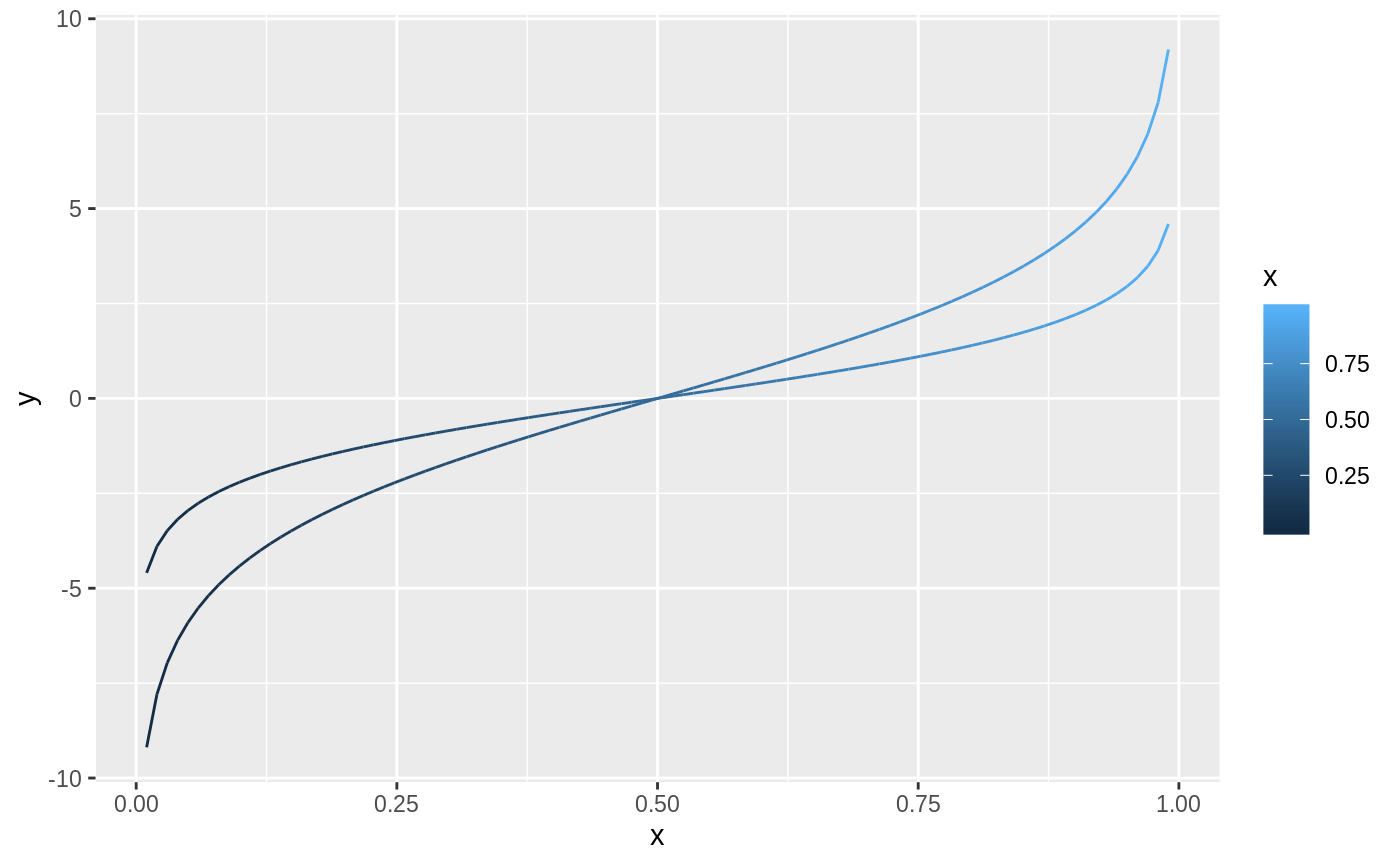
# geom_step() is useful when you want to highlight exactly when # the y value changes recent <- economics[economics$date > as.Date("2013-01-01"), ] ggplot(recent, aes(date, unemploy)) + geom_line()# geom_path lets you explore how two variables are related over time, # e.g. unemployment and personal savings rate m <- ggplot(economics, aes(unemploy/pop, psavert)) m + geom_path()# Changing parameters ---------------------------------------------- ggplot(economics, aes(date, unemploy)) + geom_line(colour = "red")# Use the arrow parameter to add an arrow to the line # See ?arrow for more details c <- ggplot(economics, aes(x = date, y = pop)) c + geom_line(arrow = arrow())# Control line join parameters df <- data.frame(x = 1:3, y = c(4, 1, 9)) base <- ggplot(df, aes(x, y)) base + geom_path(size = 10)base + geom_path(size = 10, lineend = "round")base + geom_path(size = 10, linejoin = "mitre", lineend = "butt")# You can use NAs to break the line. df <- data.frame(x = 1:5, y = c(1, 2, NA, 4, 5)) ggplot(df, aes(x, y)) + geom_point() + geom_line()#> Warning: Removed 1 rows containing missing values (geom_point).# \donttest{ # Setting line type vs colour/size # Line type needs to be applied to a line as a whole, so it can # not be used with colour or size that vary across a line x <- seq(0.01, .99, length.out = 100) df <- data.frame( x = rep(x, 2), y = c(qlogis(x), 2 * qlogis(x)), group = rep(c("a","b"), each = 100) ) p <- ggplot(df, aes(x=x, y=y, group=group)) # These work p + geom_line(linetype = 2)# }