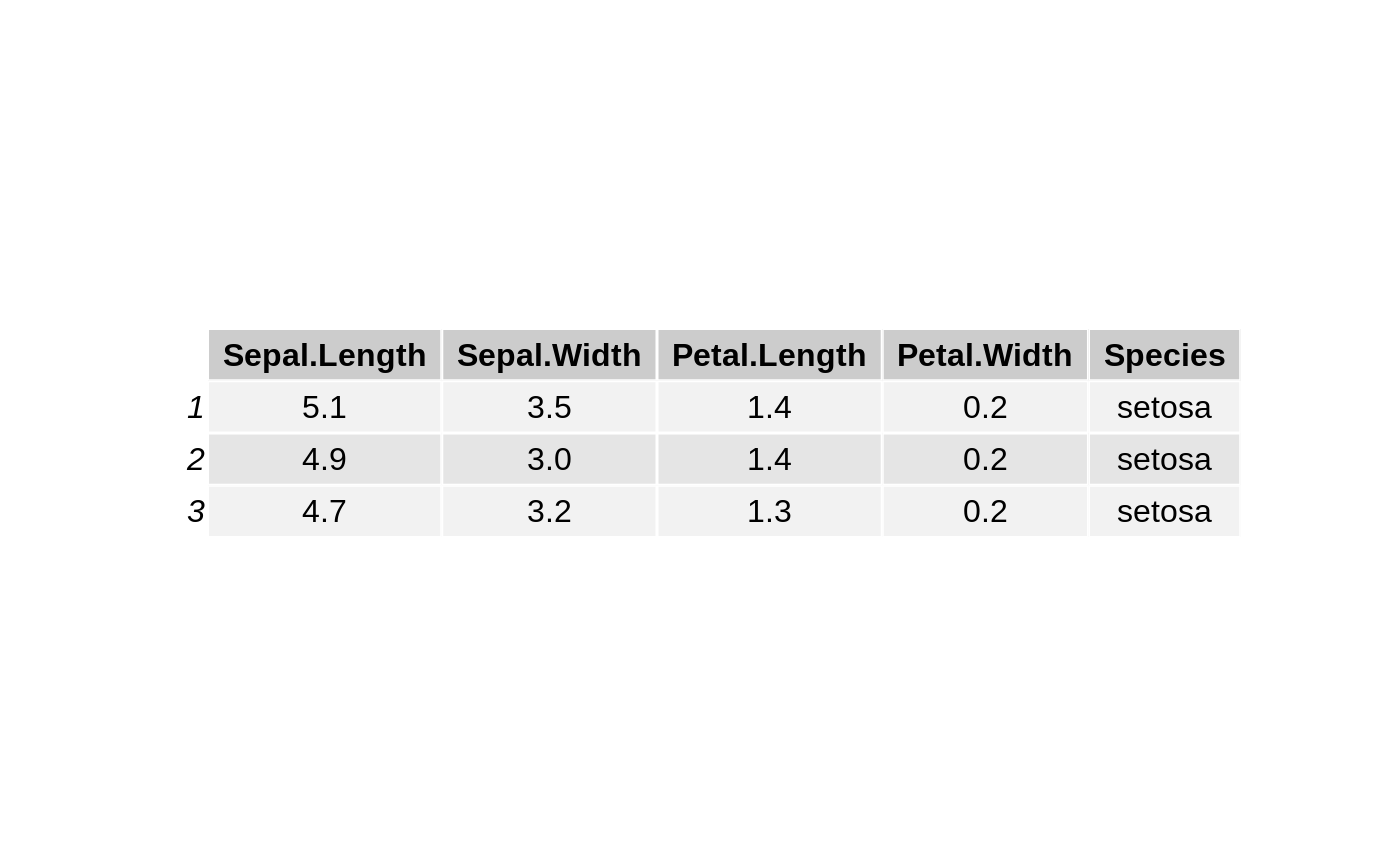
Graphical display of a textual table
tableGrob.RdCreate a gtable containing text grobs representing a character matrix.
tableGrob(d, rows = rownames(d), cols = colnames(d),
  theme = ttheme_default(), vp = NULL, ...)

grid.table(...)

ttheme_default(base_size = 12, base_colour = "black", base_family = "",
  parse = FALSE, padding = unit(c(4, 4), "mm"), ...)

ttheme_minimal(base_size = 12, base_colour = "black", base_family = "",
  parse = FALSE, padding = unit(c(4, 4), "mm"), ...)
Arguments
| d | data.frame or matrix |
|---|---|
| rows | optional vector to specify row names |
| cols | optional vector to specify column names |
| theme | list of theme parameters |
| vp | optional viewport |
| ... | further arguments to control the gtable |
| base_size | default font size |
| base_colour | default font colour |
| base_family | default font family |
| parse | logical, default behaviour for parsing text as plotmath |
| padding | length-2 unit vector specifying the horizontal and vertical padding of text within each cell |
Value
A gtable.
Functions
tableGrob: return a grobgrid.table: draw a text tablettheme_default: default theme for text tablesttheme_minimal: minimalist theme for text tables