European Union Agricultural Workforces
agriculture.RdGross National Product (GNP) per capita and percentage of the population working in agriculture for each country belonging to the European Union in 1993.
data(agriculture)
Format
A data frame with 12 observations on 2 variables:
| [ , 1] | x | numeric | per capita GNP |
| [ , 2] | y | numeric | percentage in agriculture |
The row names of the data frame indicate the countries.
Source
Eurostat (European Statistical Agency, 1994): Cijfers en feiten: Een statistisch portret van de Europese Unie.
Details
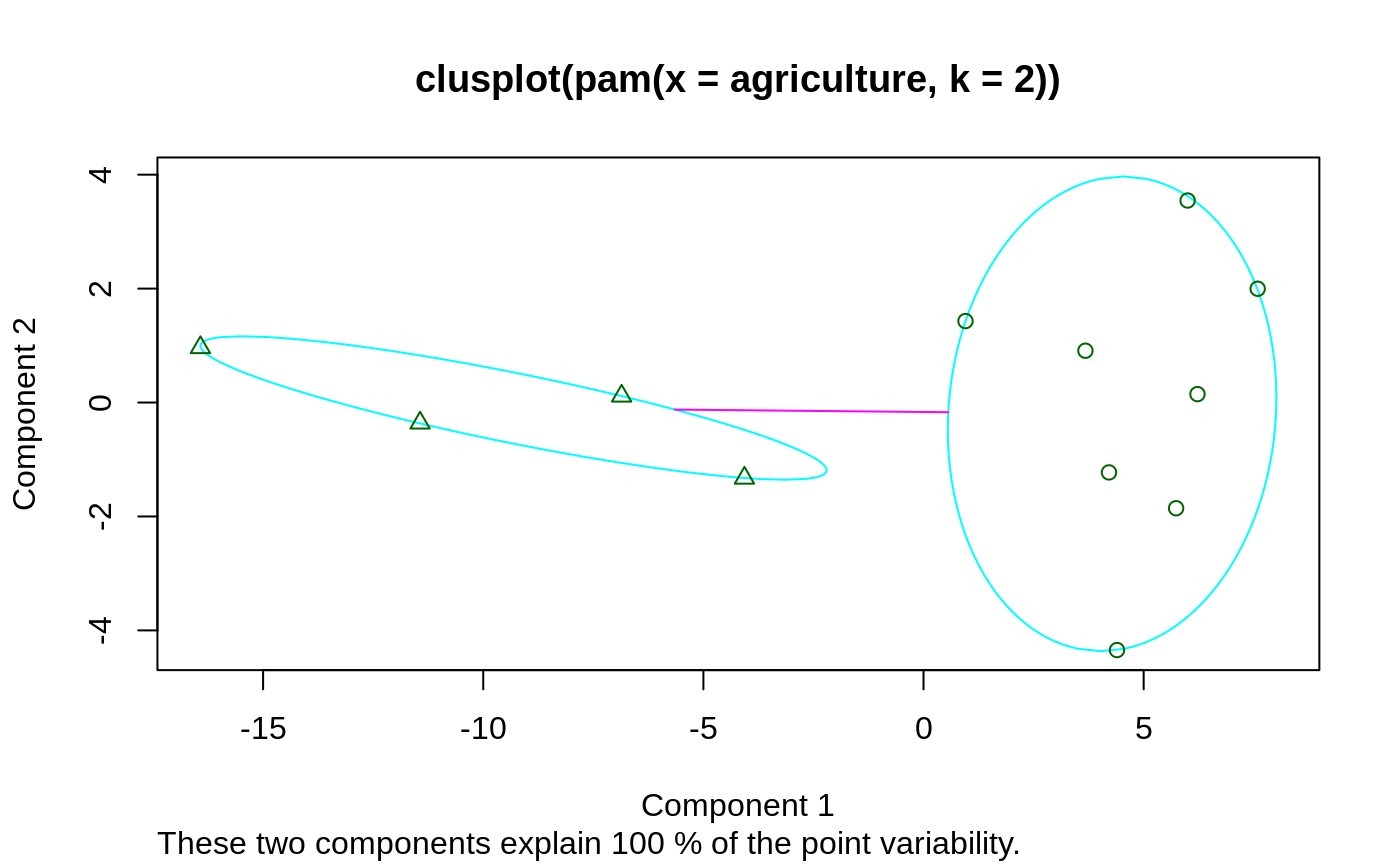
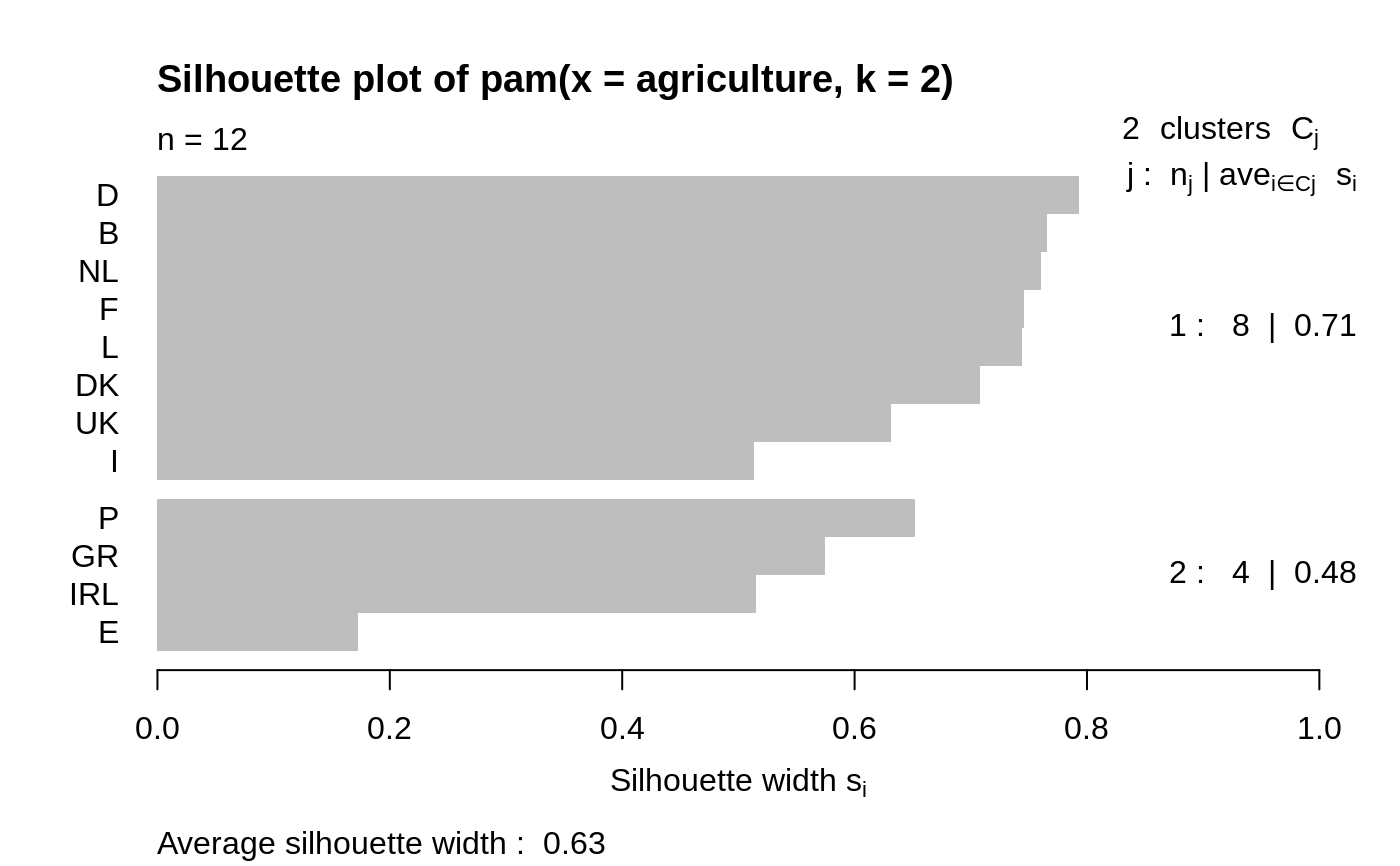
The data seem to show two clusters, the “more agricultural” one consisting of Greece, Portugal, Spain, and Ireland.
See also
References
see those in agnes.
Examples
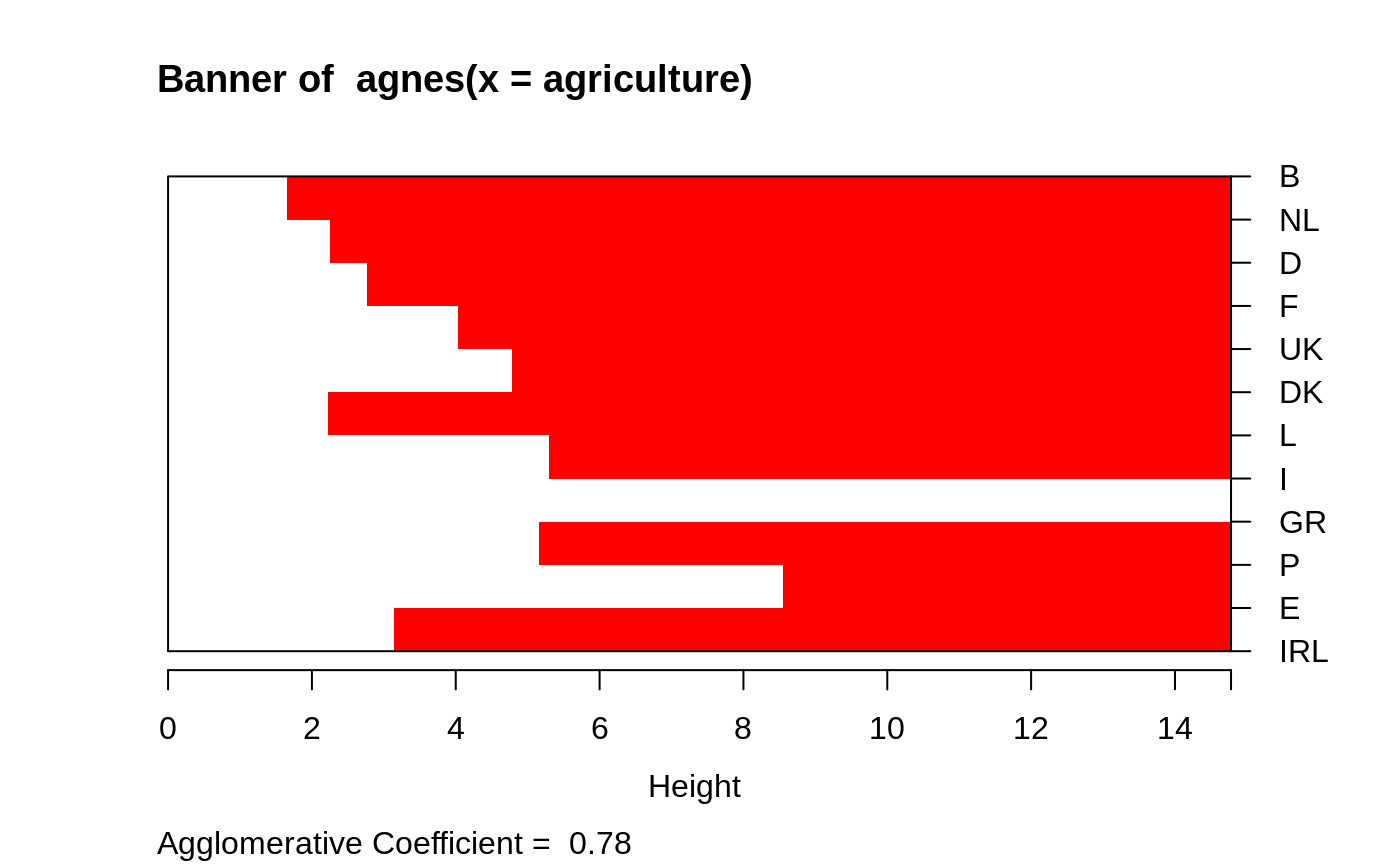
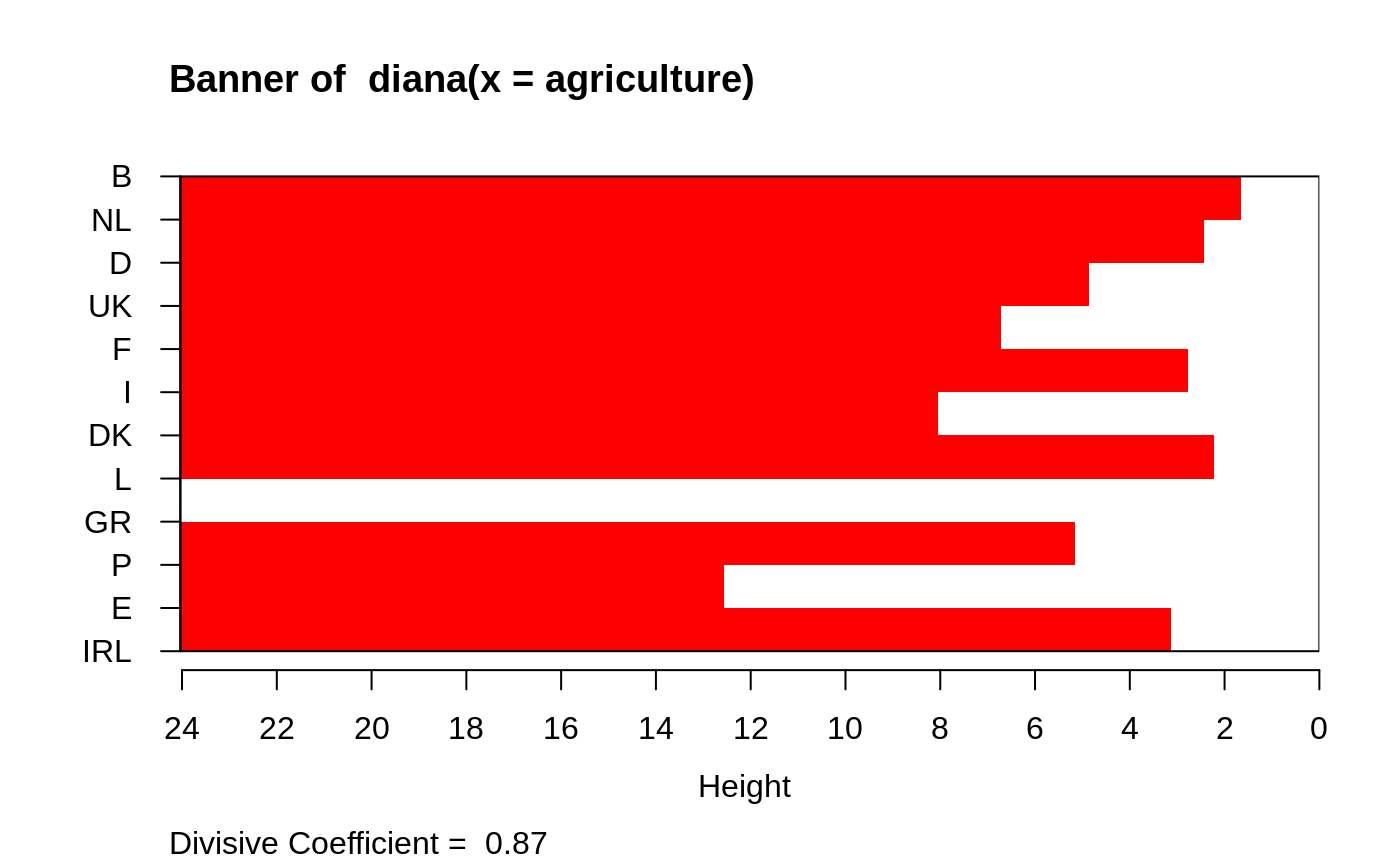
data(agriculture) ## Compute the dissimilarities using Euclidean metric and without ## standardization daisy(agriculture, metric = "euclidean", stand = FALSE)#> Dissimilarities : #> B DK D GR E F IRL #> DK 5.408327 #> D 2.061553 3.405877 #> GR 22.339651 22.570113 22.661200 #> E 9.818350 11.182576 10.394710 12.567418 #> F 3.448188 3.512834 2.657066 20.100995 8.060397 #> IRL 12.747549 13.306014 13.080138 9.604166 3.140064 10.564563 #> I 5.803447 5.470832 5.423099 17.383325 5.727128 2.773085 7.920859 #> L 4.275512 2.220360 2.300000 24.035391 12.121056 4.060788 14.569145 #> NL 1.649242 5.096077 2.435159 20.752349 8.280097 2.202272 11.150785 #> P 17.236299 17.864490 17.664088 5.162364 7.430343 15.164432 4.601087 #> UK 2.828427 8.052950 4.850773 21.485344 8.984431 5.303772 12.103718 #> I L NL P #> DK #> D #> GR #> E #> F #> IRL #> I #> L 6.660330 #> NL 4.204759 4.669047 #> P 12.515990 19.168985 15.670673 #> UK 6.723095 7.102112 3.124100 16.323296 #> #> Metric : euclidean #> Number of objects : 12## Plot similar to Figure 7 in Struyf et al (1996) if (FALSE) plot(agnes(agriculture), ask = TRUE) plot(agnes(agriculture))## Plot similar to Figure 8 in Struyf et al (1996) if (FALSE) plot(diana(agriculture), ask = TRUE) plot(diana(agriculture))


