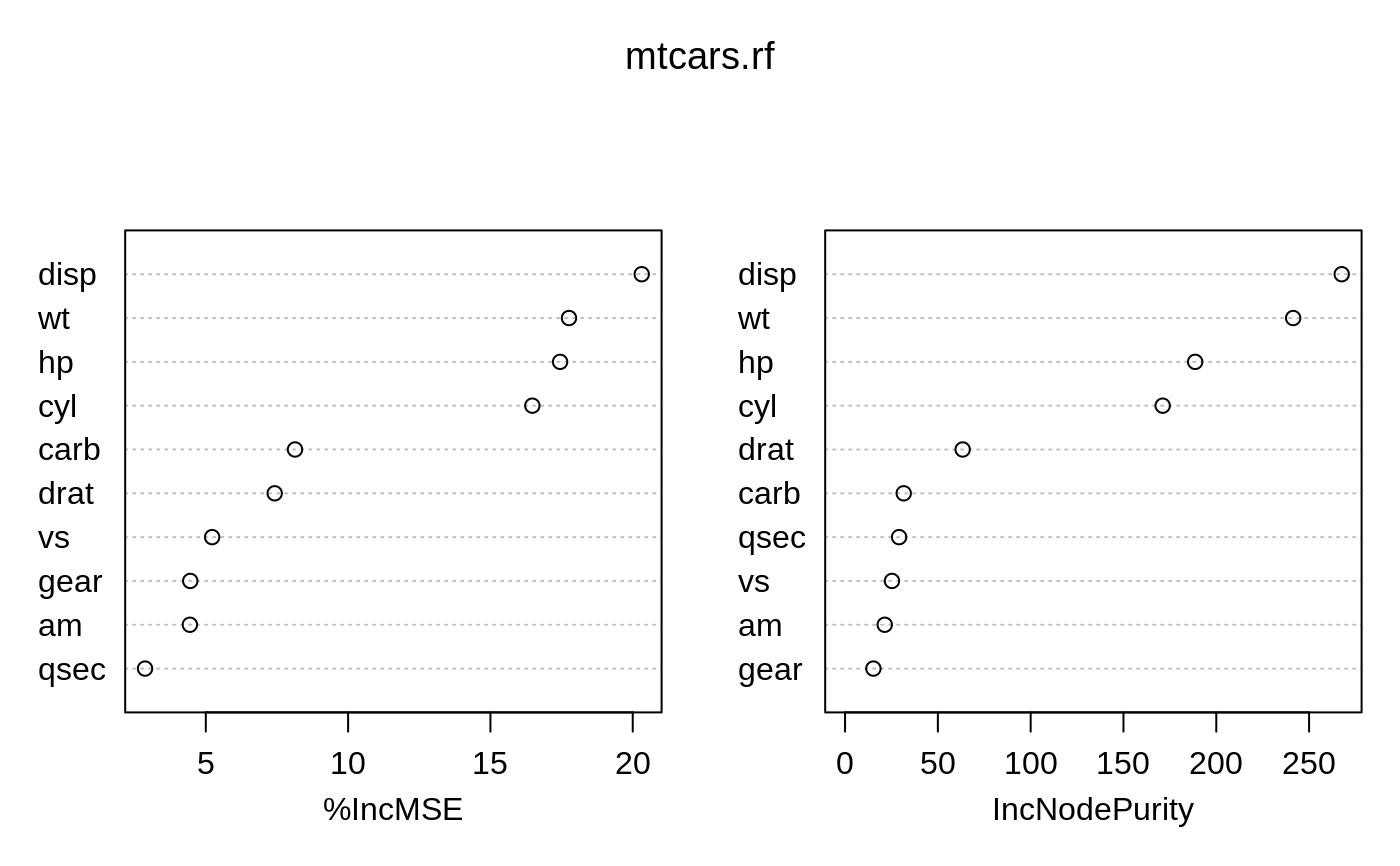
Variable Importance Plot
varImpPlot.RdDotchart of variable importance as measured by a Random Forest
varImpPlot(x, sort=TRUE, n.var=min(30, nrow(x$importance)),
           type=NULL, class=NULL, scale=TRUE,
           main=deparse(substitute(x)), ...)
Arguments
| x | An object of class |
|---|---|
| sort | Should the variables be sorted in decreasing order of importance? |
| n.var | How many variables to show? (Ignored if
|
| type, class, scale | arguments to be passed on to
|
| main | plot title. |
| ... | Other graphical parameters to be passed on to
|
Value
Invisibly, the importance of the variables that were plotted.
See also
Examples
set.seed(4543)
data(mtcars)
mtcars.rf <- randomForest(mpg ~ ., data=mtcars, ntree=1000, keep.forest=FALSE,
                          importance=TRUE)
varImpPlot(mtcars.rf)